Flood hydrograph for Mytholmroyd
Communities along the Calder Valley in West Yorkshire are assessing the damage following severe flooding caused by Storm Ciara.
The Environment Agency said about 100mm of rain fell in a 12-18 hour period, leading to “raging torrents” in places.
Calderdale Council said 500 homes and about 400 businesses had been flooded.
The area was devastated by flooding at Christmas in 2015 and millions of pounds were invested in flood defences.
However, some of those, including a £30m scheme in Mytholmroyd, are not due to be completed until the summer.
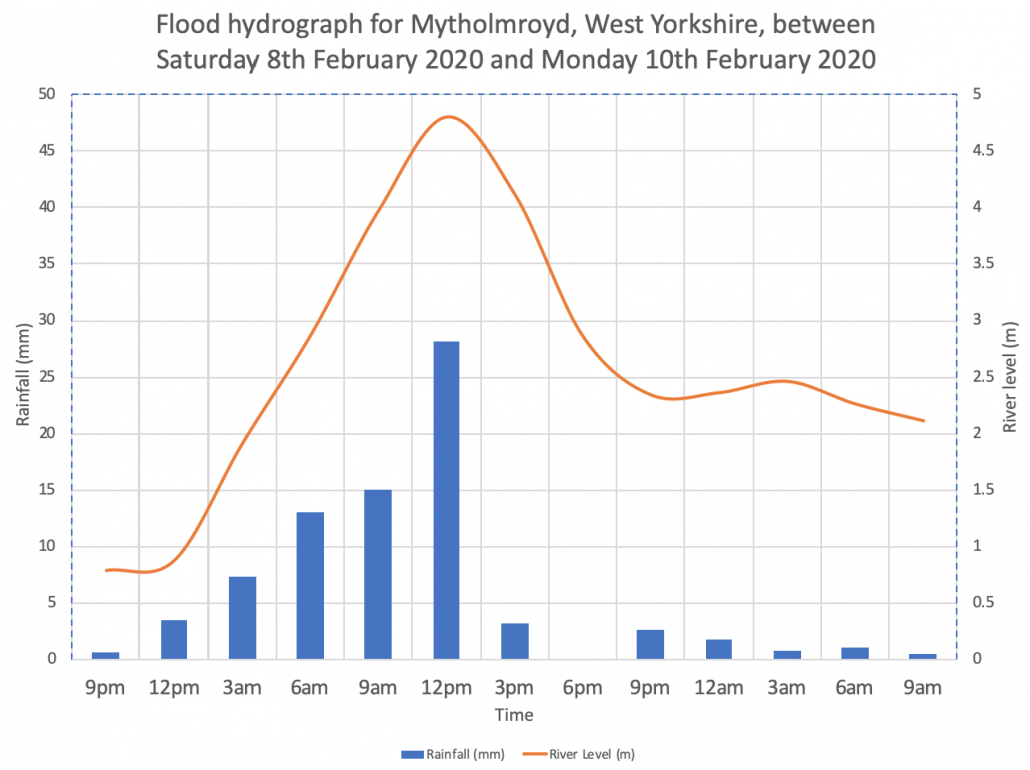
The flood hydrograph below shows the level of the River Calder at Mytholmroyd, West Yorkshire along with rainfall levels. Bankfull discharge for the river at this point is around 3.8m.
The graph shows a very short lag time. Rainwater is quickly entering the river channel. Poor management of moorland in the upper stages of the river was blamed for the flood event that affected the area in 2015.
Flood Hydrograph for Mytholmroyd
You can download the spreadsheet containing the raw data and hydrograph here.


Leave a Reply
Want to join the discussion?Feel free to contribute!