Using images in Geography #1 Identify, classify, rank and justify
Images are a great way of encouraging thinking skills in the geography classroom. This series of posts explores a range of strategies to support the development of thinking through the use of images.
Using images in Geography #1 Identify, classify, rank and justify
Identify, classify, rank and justify is a technique that can be used to explore the impact of a range of human and physical manifestations such as earthquakes, hurricanes, volcanic eruptions, deforestation and climate change. Using this technique involves sharing a collection of images that illustrate the primary and secondary impacts of an occurrence such as an earthquake along with human responses to it. An example is shown below.
First of all, learners identify the cause and impacts of the earthquake. This encourages them to consider what caused the problem and the different types of impacts this can cause. It is a useful way of introducing new information to learners (rather than just telling them!). It is useful to get feedback from students via targeted questioning to check understanding and overcome misconceptions.
Next, the learners then classify the impacts by attempting to group them. Learners can sometimes come up with some weird and wonderful groupings so it is worth checking learning by circulating and questioning. Lower attaining students may need a prompt to support them e.g. group the impacts into primary and secondary effects. The learners then have to identify a grouping for those images left over. In the case above this would be responses to the earthquake.
Learners then rank the primary and secondary effects according to their impact. They should then be encouraged to discuss these rankings in pairs to help consolidate their understanding and begin to give reasons for their choices.
Finally, they then produce a piece of extended writing to justify their views. This helps support students develop their ability to tackle higher order thinking questions.
I’ve found this technique works really well in my classroom with my students. If you have a go please let me know how it went.
If you use images in a way that has a positive impact on learning please use the contact form to get in touch!
Anthony Bennett
Map your photos using Google Maps
Using Google Images and Google Maps you can easily create a map using an album of geotagged photos. Geotagged photos are those that include data on the location they were taken. Most modern mobile phones have this feature as do some digital cameras. If you are not sure a quick search on the Internet will tell you if this option is available and how to enable it.
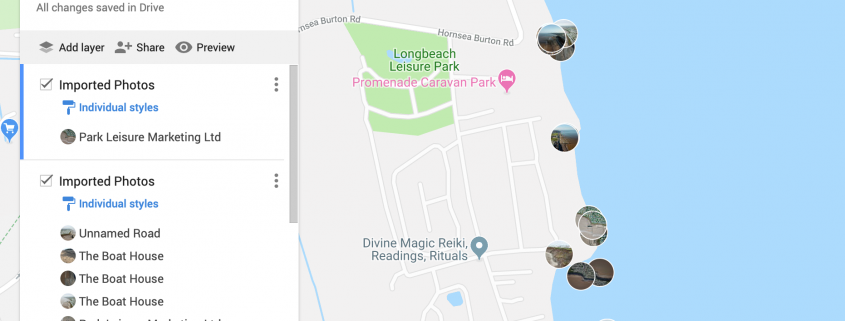
Below is a map showing the location of a number of images taken in and around Hornsea on the Holderness Coast using an iPhone and a drone.
Looks complicated? Don’t worry, it’s not! Just follow the steps below.
To begin with, you will need to upload your geotagged photos to a new album in Google Photos. To do this login to your Google account and go to https://photos.google.com. Next create a new album by clicking +Create in the top right corner, then select Album.
Give the folder a title then upload the images you want to map.
Next, go to https://www.google.com/maps/d/ and select +Create New Map (top left corner). Your new map will open and be called Untitled map. Give your image a suitable title by clicking untitled map in the top left window.
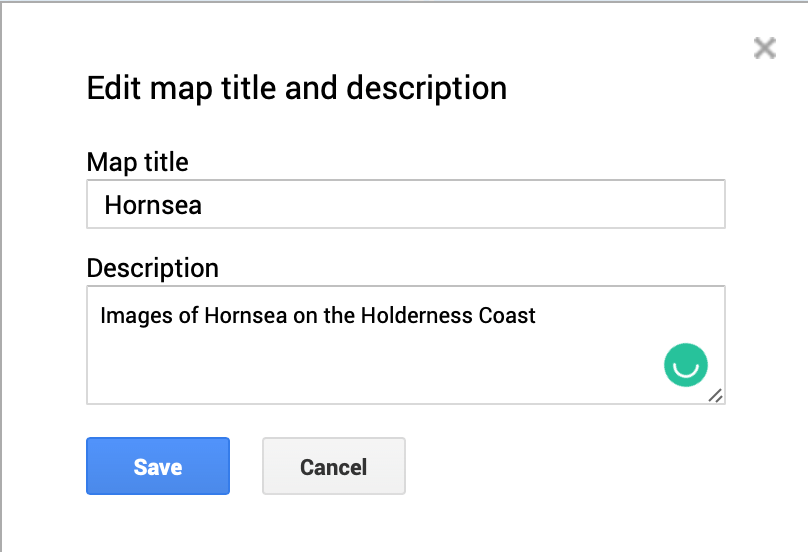
Click Save.
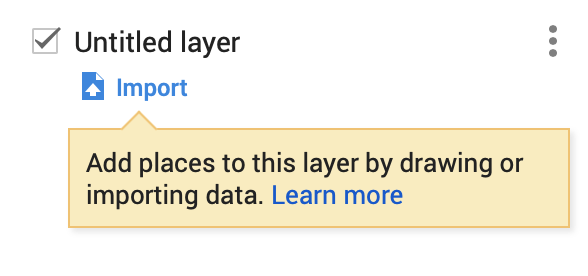
Next click Import (under the first layer which is called Untitled layer).
Click the Photo albums tab. Next, locate the album where your photos are stored. Select all the images you want to import onto the map.
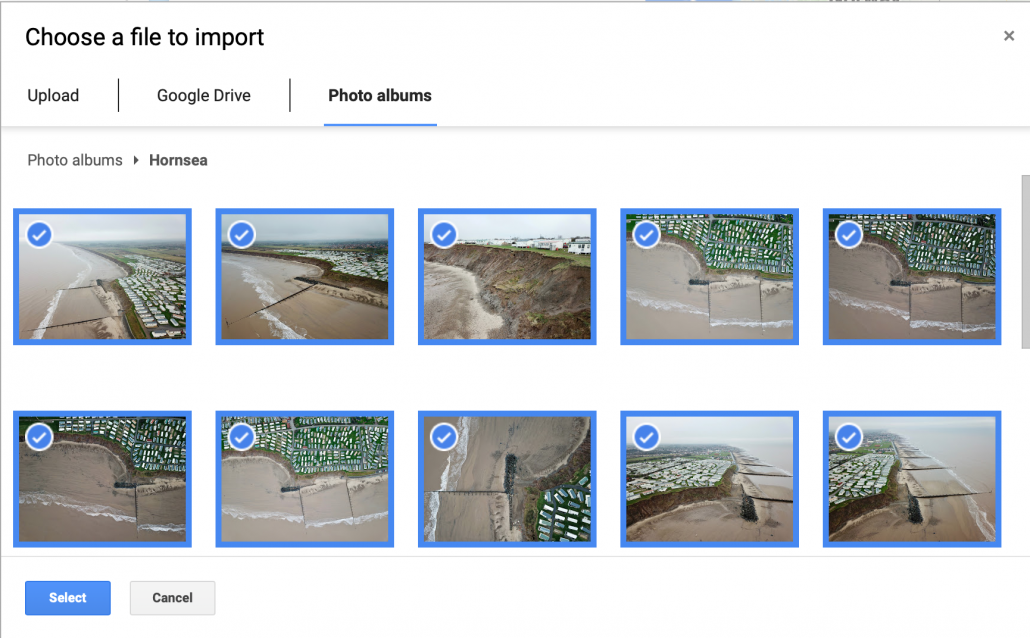
Next, click Select. The photos will then be copied onto your map.
This will create at least one layer containing your images and an icon of each image will be displayed on the map.
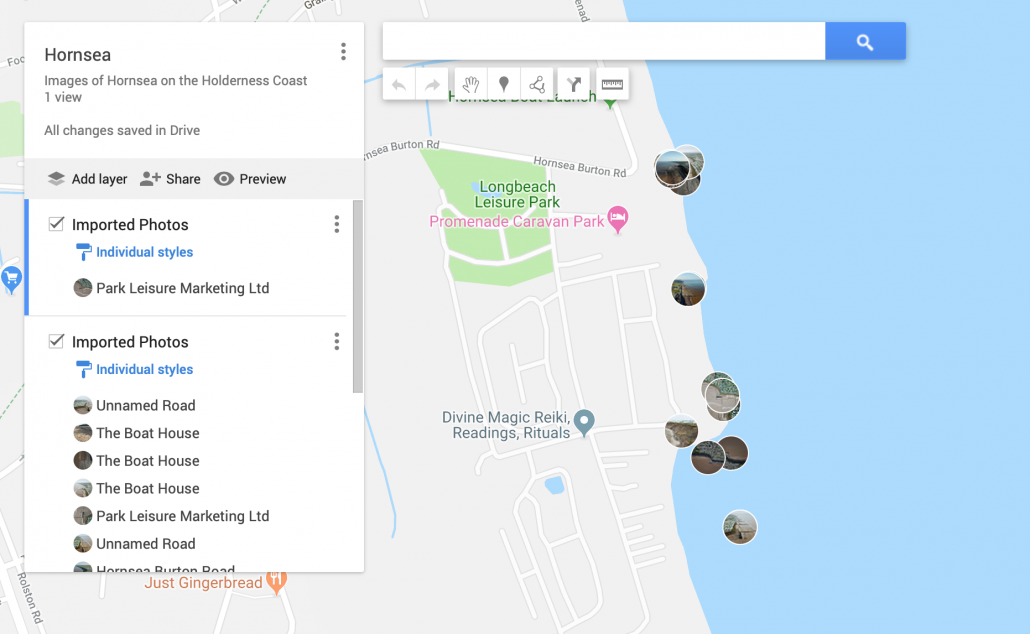
You will notice that each photograph has been given a title based on the location it was taken. You should go through these and rename them as appropriate. Once you’ve finished you can share your map with others by clicking Share > Change > On. You can then share the URL. You can also embed the map on a website by clicking the three dots next to the map title. Then select Embed on My Site.
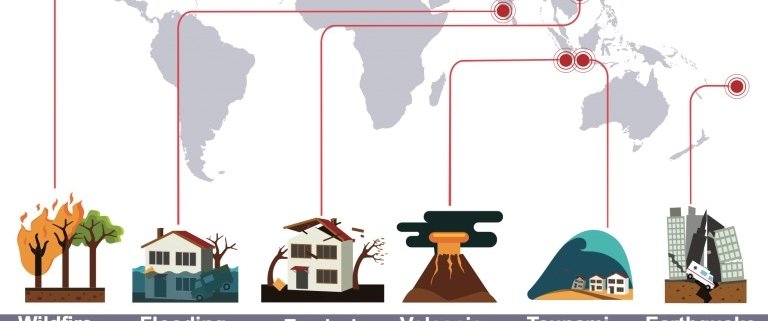
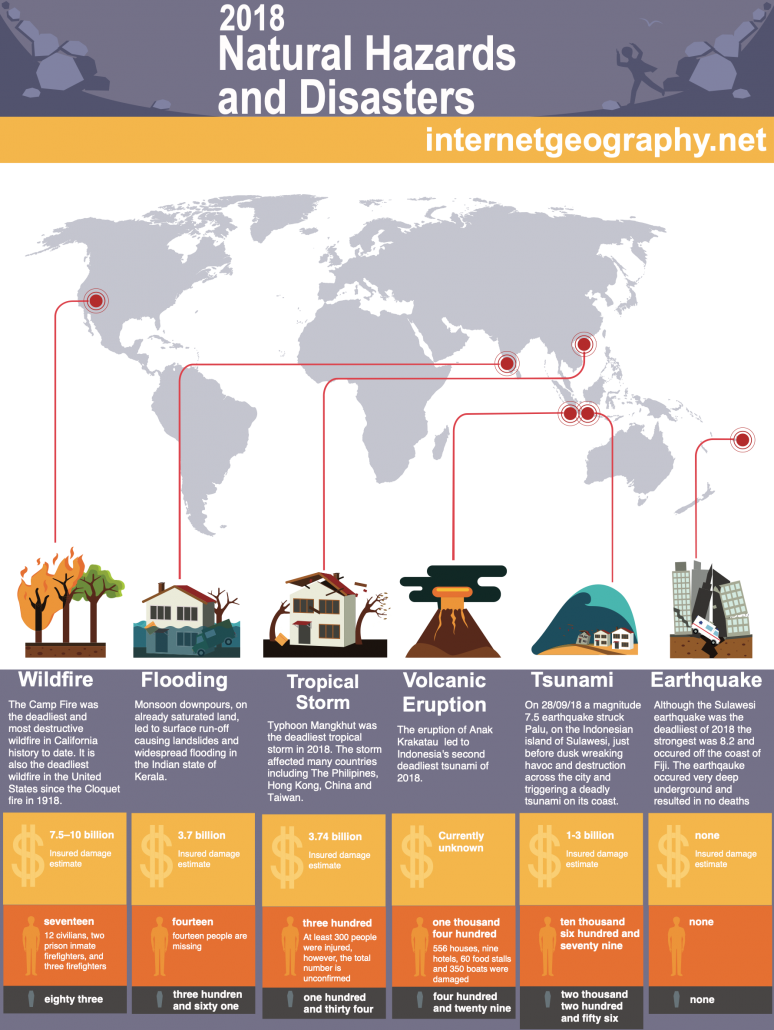
2018 Natural Hazards and Disasters Poster
2018 saw a range of natural hazards affecting people and places across the planet. We’ve collated some of the deadliest and most powerful natural hazards of 2018 and put them into the infographic below. Ideal for the AQA Challenge of Natural Hazards Unit.
Have you seen our Natural Hazards Memory Geoggers?
Click the image below to download an A3 colour copy of the poster for free.


Leave a Reply
Want to join the discussion?Feel free to contribute!