Changing rates of rainforest deforestation
How are rates of rainforest deforestation changing?
Before we examine the changing rates of rainforest deforestation, it would be helpful to recap the distribution of tropical rainforests. The graph below shows the world’s largest primary tropical rainforests in 2020.
Tropical rainforest is found within the borders of 62 countries. The graph below shows the top 25 countries.
It is estimated by the UN Food and Agriculture Organization that about half the world’s tropical rainforest has been cleared.
The graph below shows the annual deforestation of primary rainforest by area between 2002 and 2022.
The moving average indicates an increase in the rates of tropical rainforest deforestation globally.
Today, the global rate of rainforest clearance is estimated to be:
The map below shows the % of land covered in forest between 1990 and 2015 for countries worldwide. By hovering over a country, you can see the proportion of land covered by forest. Clicking a country will display a graph showing changes in forest cover between 1990 and 2015. Exploring the countries located along the equator, it is clear that in most cases, forest cover is reducing due to deforestation. This includes countries with large rainforest areas, such as Brazil, the Democratic Republic of Congo, Peru and Indonesia. There are some exceptions; for example, forest cover in Gabon has increased.
Rates of deforestation vary between countries. The graph below shows the total forest loss by rainforest cover in the top 24 countries between 2001 and 2018.
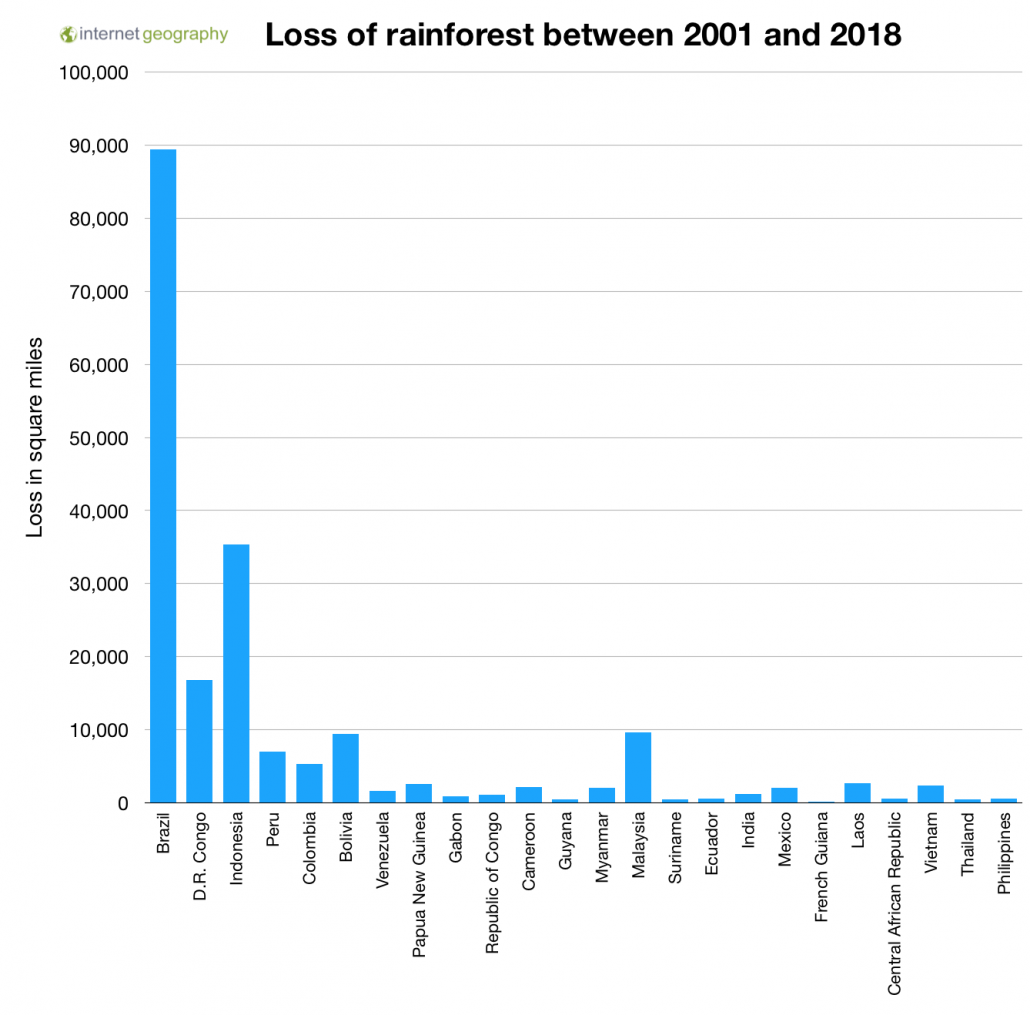
Loss of rainforest between 2001 and 2018
The graph below shows deforestation rates in the Amazon rainforest between 2001 and 2024.
The graph shows a high level of deforestation in the early 2000s, peaking in 2003 when deforestation was the highest ever recorded rate. After this peak, there was a marked decrease in deforestation, which reached its lowest level around 2009. Following this low, the annual rates fluctuate, with some years showing slight increases and others showing decreases. There is a noticeable increase in 2016, followed by a trend of variable rates for the next few years. 2020 shows an uptick in deforestation compared to the previous year. The overall trend shows a general decrease from the early 2000s peak, although there are several years when the rates have risen.
The graph below shows rates of Amazon deforestation by country between 2001 and 2020.
The highest rate of Amazon rainforest deforestation occurs in Brazil. The graph below shows changing deforestation rates in Brazil between 1988 and 2024.


Use the images below to explore related GeoTopics.