Coastal Fieldwork Techniques
Coastal environments provide many opportunities for fieldwork investigations.

Coasts are dynamic environments with processes such as erosion, transportation and deposition creating characteristic landforms. Coastal environments are vulnerable to erosion, flooding and sea level rise. Where this puts coastal communities at risk, management solutions are frequently used in an attempt to protect these areas, particularly where population densities are high. As the result of this coastal environments offer the opportunity for a wide range of fieldwork investigations.
A beach profile shows the cross-sectional shape of a beach, usually from the edge of the sea to the base of the cliff.
To create a beach profile follow a straight transect line from the edge of the sea to the end of the active beach. Split the line into sections where the slope angle changes. You need to measure the length of each section and its angle. To do this:
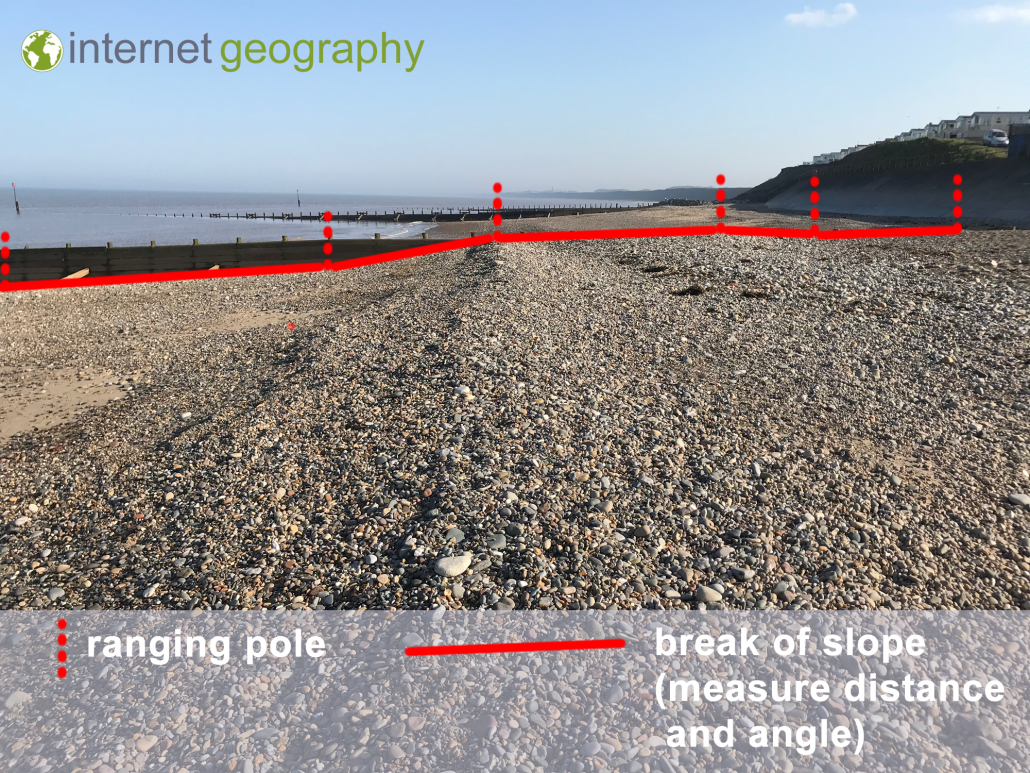
Beach Transect
Beach profiles can also be used to calculate cross-sectional area and the amount of beach material present.
Beach sediment, such as sand, gravel and pebbles, can be analysed by random, systematic and/or stratified sampling. The size of the sediments determines the measuring technique.
Coarse sediments on the beach can be measured by their size and shape. This should be done on the beach, never take sediments from the beach.
To measure this material use a ruler or callipers to determine their a, b and c axes. The a-axis is the longest axis. The b-axis is the widest axis at right angles to the a-axis. The shortest axis is the c-axis.
Power’s Scale of Roundness is the easiest way to record pebble shape. You can judge by eye whether a stone is very angular, angular, sub-angular, sub-rounded, rounded or very rounded.
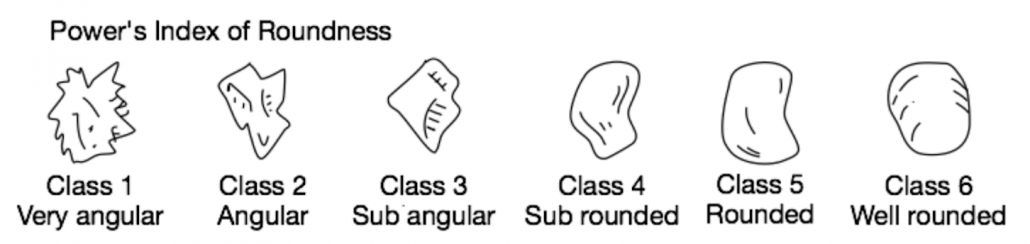
Power’s Scale of Roundness
Use a concentric circle card or protractor to measure the minimum radius of the curvature. This is the sharpest corner of the a-axis.
Fine sediments, such as clay, silt and sand, will need to be taken from the beach to the lab. Each sample will need to be sealed separately and labelled accurately.
Using graduated sieves sort the sediment samples into size categories (in phi or mm sizes).
Arrange the sieves into decreasing mesh diameter. Please the sediment sample into the top sieve. Then shake the sieve and sort the sediment. Record the mass of the contents of each sieve. Calculate the percentage of the sample in each sieve.
Using a float, such as an orange, ball or cork you can identify the rate of longshore drift at a location of choice. To begin with, you should decide on the distance you will measure longshore drift over, for example, 10 metres. Measure your start and finish points using a tape measure as close to the watermark as you can. Put your float into the water at the start point. Record the time it takes for the float to be transported to the finish point. You could also measure longshore drift by recording the distance the float travels over a set period of time e.g. 5 minutes.
When measuring longshore drift you should also consider recording wind speed and direction as these can affect longshore drift.
Technique 4 – Measuring the impact of groynes on longshore drift
A popular fieldwork technique is to investigate the impact of groynes on longshore drift. The difference in height of the beach either side of the groyne will give an indication of the effectiveness of groynes in trapping material being transported by longshore drift. The more effective the groyne the greater the distance between beach levels either side of the groyne. To do this:
Before completing coastal fieldwork it is essential that you complete a risk assessment. You should start by examining potential risks by using GIS such as Google Earth. This will allow you to identify potential hazards and safe ways to access the beach. You should also check tide times. It is best to complete fieldwork at the coast when the tide low. You should also check the weather forecast to identify any potential hazards. The stronger the wind the larger the waves are likely to be.




Use the images below to explore related GeoTopics.


