Communities along the Calder Valley in West Yorkshire are assessing the damage following severe flooding caused by Storm Ciara.
The Environment Agency said about 100mm of rain fell in a 12-18 hour period, leading to “raging torrents” in places.
Calderdale Council said 500 homes and about 400 businesses had been flooded.
The area was devastated by flooding at Christmas in 2015 and millions of pounds were invested in flood defences.
However, some of those, including a £30m scheme in Mytholmroyd, are not due to be completed until the summer.
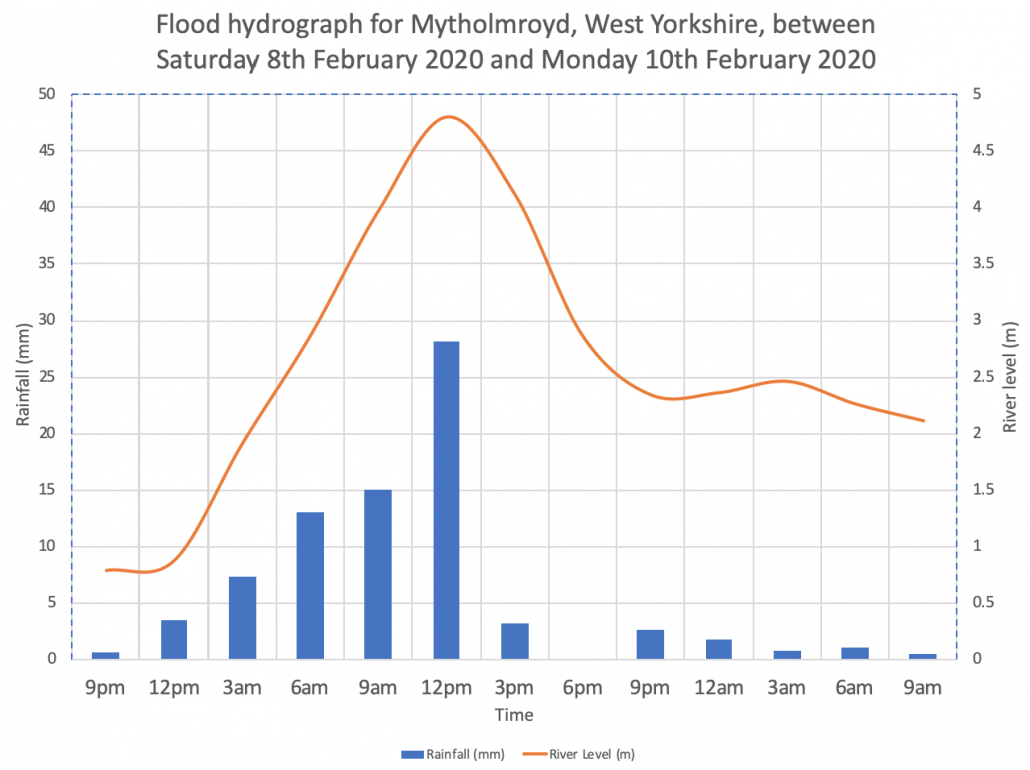
The flood hydrograph below shows the level of the River Calder at Mytholmroyd, West Yorkshire along with rainfall levels. Bankfull discharge for the river at this point is around 3.8m.
The graph shows a very short lag time. Rainwater is quickly entering the river channel. Poor management of moorland in the upper stages of the river was blamed for the flood event that affected the area in 2015.
Flood Hydrograph for Mytholmroyd
You can download the spreadsheet containing the raw data and hydrograph here.
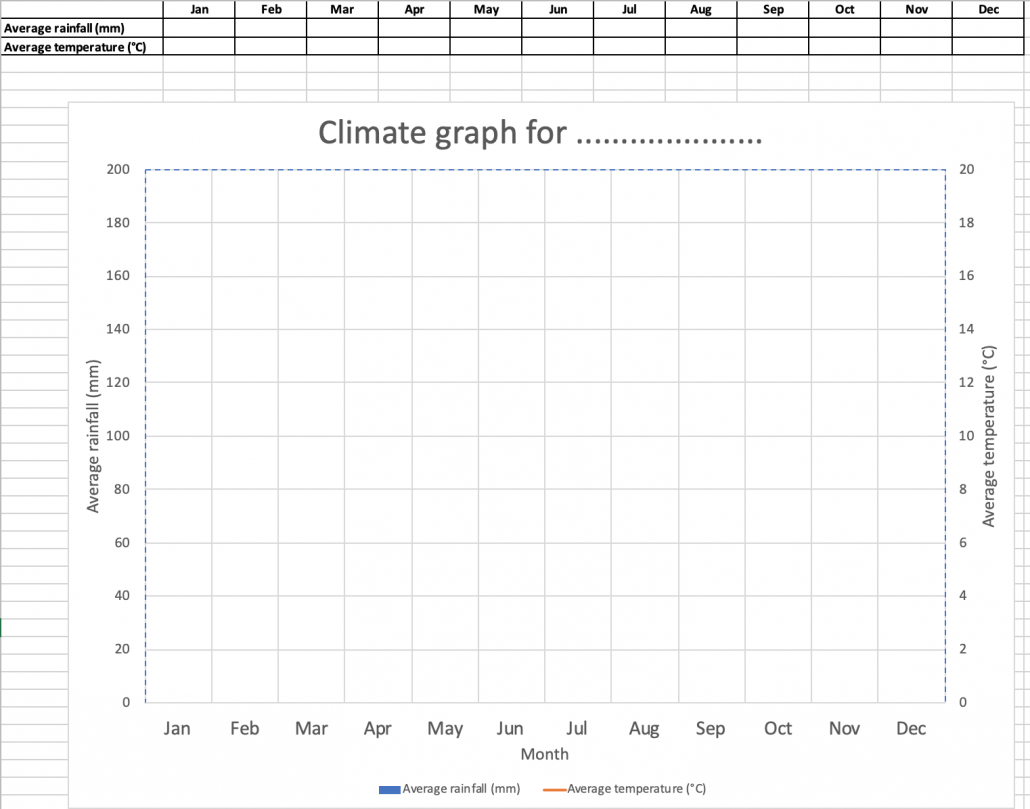
Climate graphs can be a bit fiddly to create in Excel so we’ve created an editable template for you to use. In our example, we’ve produced a climate graph for the UK based on Met Office data for 2018.
Climate graph for the UK
We have also included a blank template that can be edited and given to students to complete by hand.
We’ve pulled tother a collection of fantastic websites that provide a range of geographical data. The websites are in no particular order, but each is worth exploring.
If you have any more data driven sites to recommend please leave a comment below!
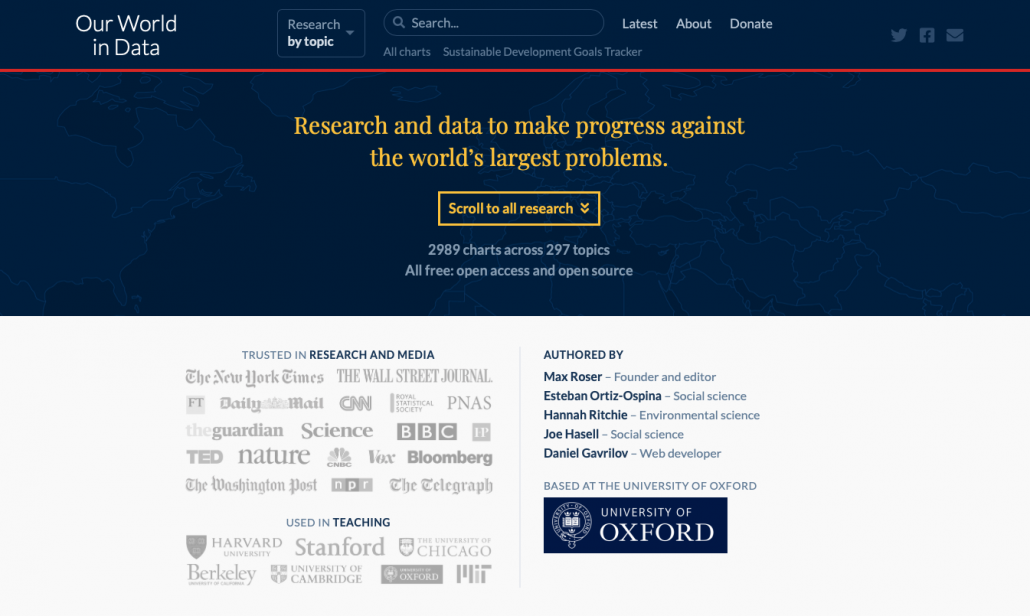
Our World in Data
Our World in Data
Research and interactive data visualisations to understand the world’s largest problems by Oxford University. What makes this site so good is the dialogue that accompanies the beautifully presented data.
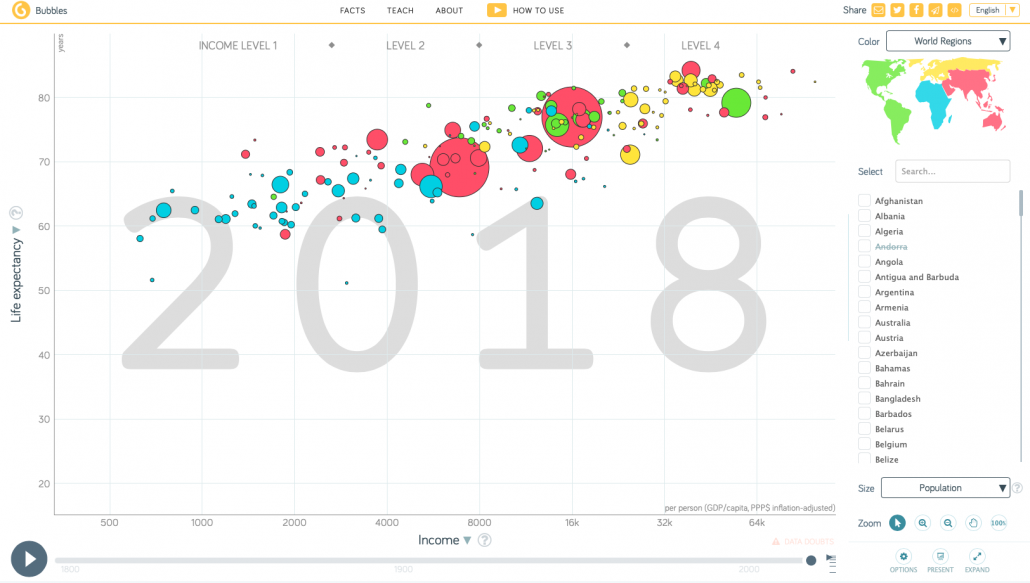
Gapminder is an independent Swedish foundation with no political, religious or economic affiliations. Gapminder is a fact tank, not a think tank. Gapminder fights devastating misconceptions about global development. Reliable data can be presented in a range of eye-catching ways.
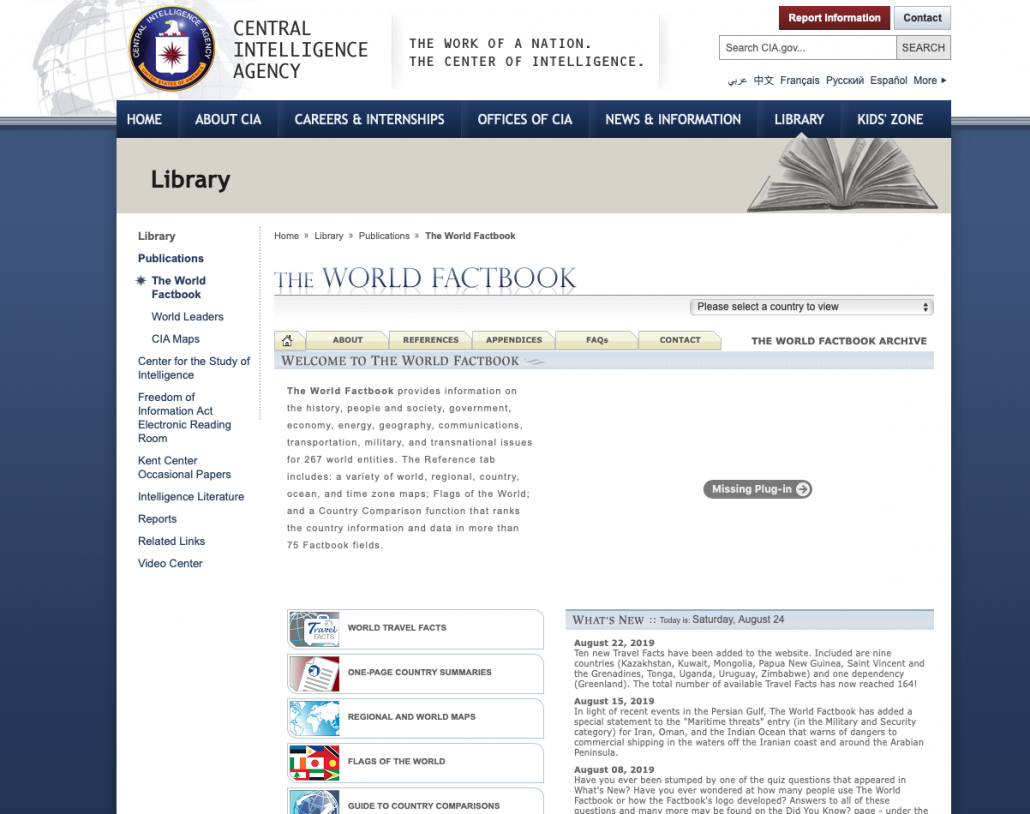
The World Factbook provides information on the history, people and society, government, economy, energy, geography, communications, transportation, military, and transnational issues for 267 world entities.
https://www.internetgeography.net/wp-content/uploads/2019/08/10-amazing-sites-for-geographical-data.png6701200Anthony Bennetthttps://www.internetgeography.net/wp-content/uploads/2024/01/Internet-Geography-Logo.pngAnthony Bennett2019-08-24 13:19:002026-06-16 15:30:2810 amazing sites for geographical data
Using Google Images and Google Maps you can easily create a map using an album of geotagged photos. Geotagged photos are those that include data on the location they were taken. Most modern mobile phones have this feature as do some digital cameras. If you are not sure a quick search on the Internet will tell you if this option is available and how to enable it.
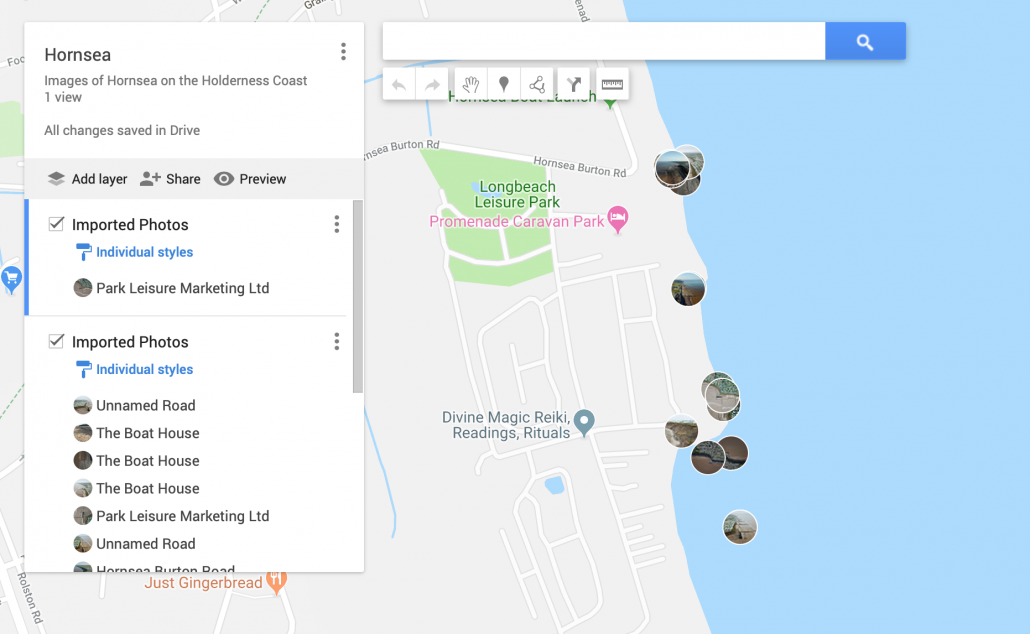
Below is a map showing the location of a number of images taken in and around Hornsea on the Holderness Coast using an iPhone and a drone.
Looks complicated? Don’t worry, it’s not! Just follow the steps below.
To begin with, you will need to upload your geotagged photos to a new album in Google Photos. To do this login to your Google account and go to https://photos.google.com. Next create a new album by clicking +Create in the top right corner, then select Album.
Give the folder a title then upload the images you want to map.
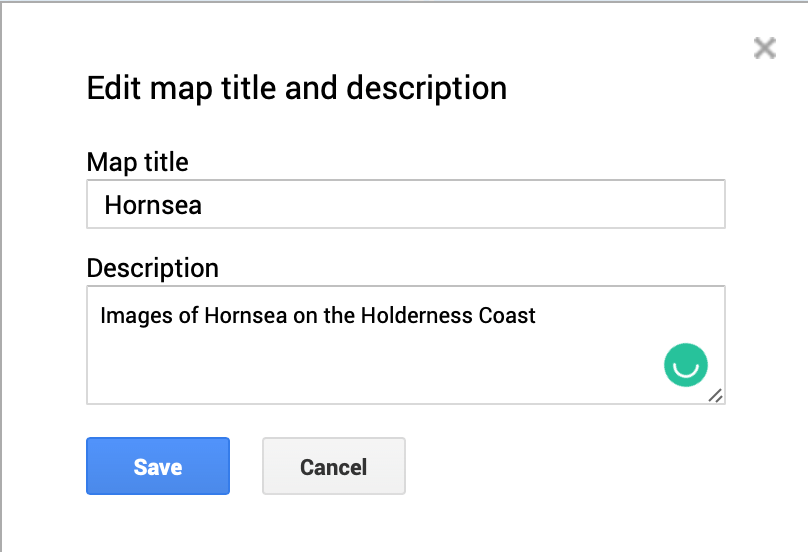
Next, go to https://www.google.com/maps/d/ and select +Create New Map (top left corner). Your new map will open and be called Untitled map. Give your image a suitable title by clicking untitled map in the top left window.
Rename your map.
Click Save.
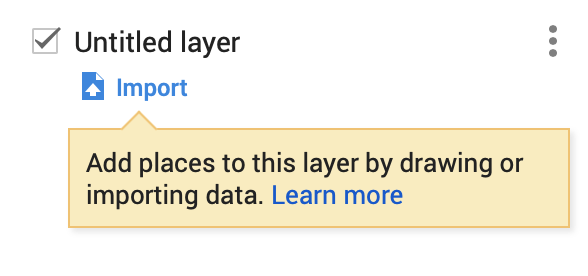
Next click Import (under the first layer which is called Untitled layer).
Click Import
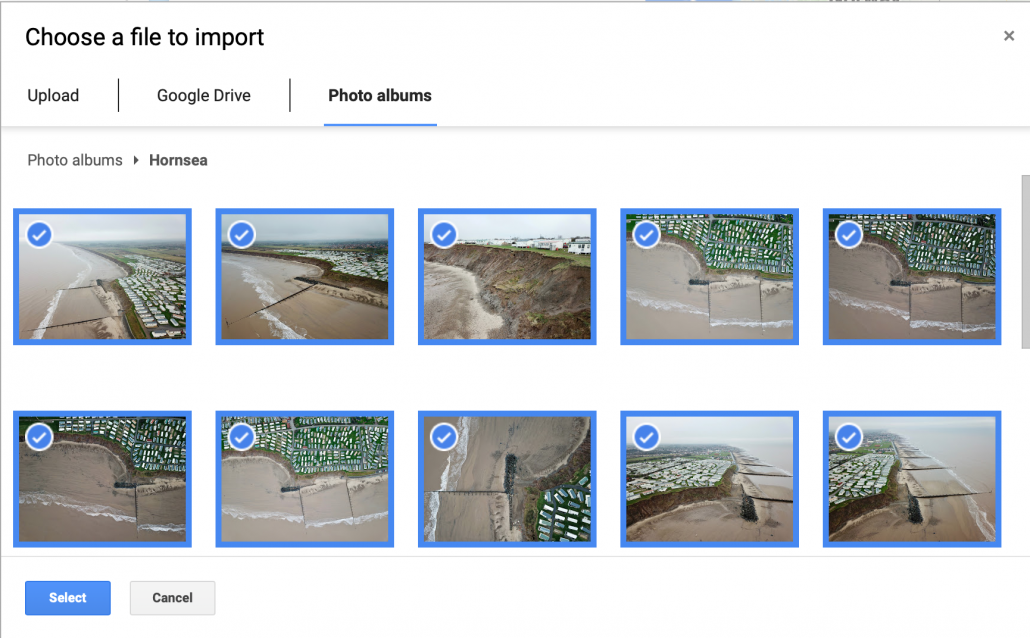
Click the Photo albums tab. Next, locate the album where your photos are stored. Select all the images you want to import onto the map.
Select images you want to import
Next, click Select. The photos will then be copied onto your map.
This will create at least one layer containing your images and an icon of each image will be displayed on the map.
Imported images and new layers
You will notice that each photograph has been given a title based on the location it was taken. You should go through these and rename them as appropriate. Once you’ve finished you can share your map with others by clicking Share > Change > On. You can then share the URL. You can also embed the map on a website by clicking the three dots next to the map title. Then select Embed on My Site.
https://www.internetgeography.net/wp-content/uploads/2019/02/Imported-images.png9851600Anthony Bennetthttps://www.internetgeography.net/wp-content/uploads/2024/01/Internet-Geography-Logo.pngAnthony Bennett2019-02-01 18:41:022026-06-16 15:32:38Map your photos using Google Maps
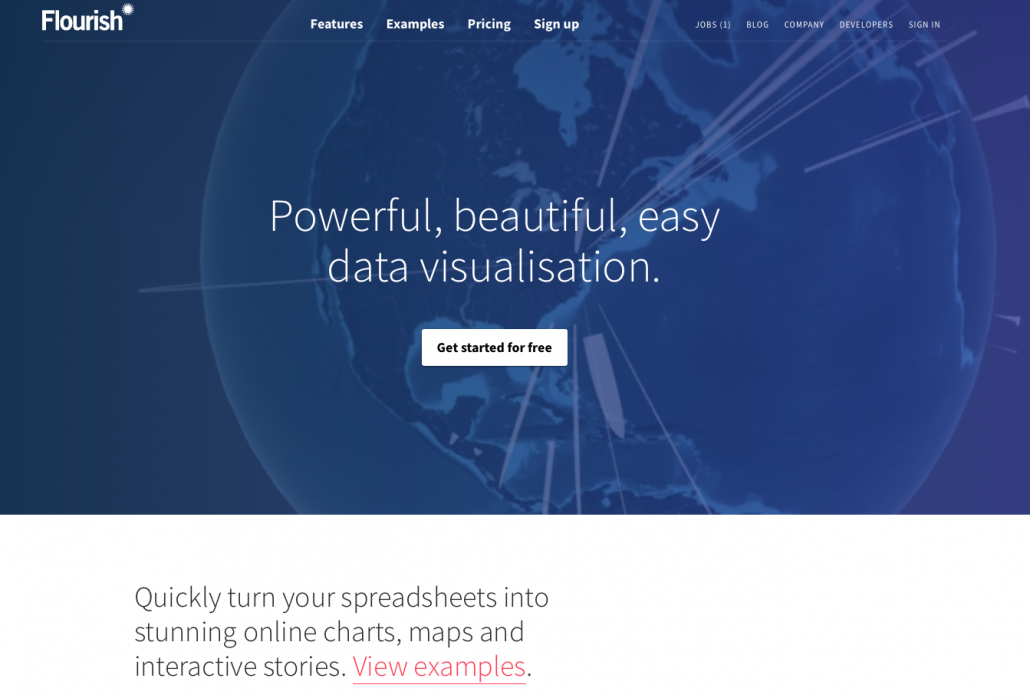
https://www.internetgeography.net/wp-content/uploads/2018/06/Flourish.png8871600Anthony Bennetthttps://www.internetgeography.net/wp-content/uploads/2024/01/Internet-Geography-Logo.pngAnthony Bennett2018-06-27 16:45:502026-06-16 15:36:38Flourish with your data presentation and interrogation