Mote is a Chrome extension that allows you to provide verbal feedback in Google Docs, Sheets and Slide. To install Mote, launch Chrome (if you don’t have it installed you can get it here), then go to the Chrome web store. Type Mote into the search bar of the Chrome store (top left). When you’ve found Mote click the install button and follow the on-screen instructions.
Once you’ve installed the plugin open either a Google Sheets, Docs or Slides file. You will see a new Mote icon (circled in red below).
More icon
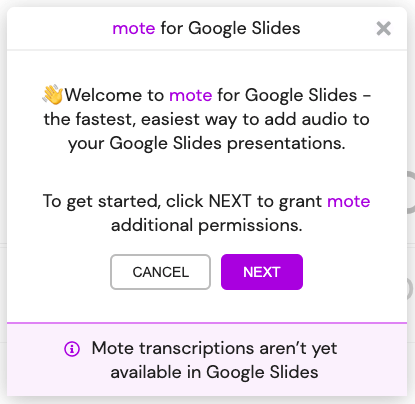
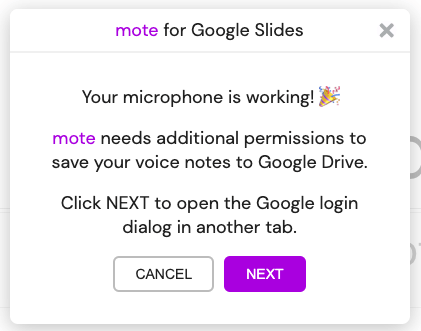
Click the Mote icon. Click next when the pop-up below is displayed.
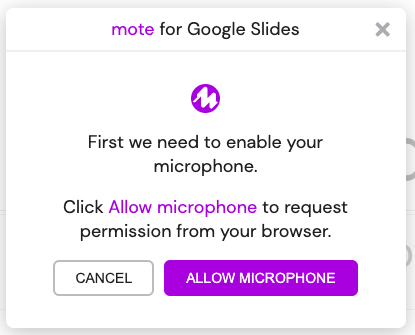
Next, you need to grant access to your microphone so voice messages can be recorded.
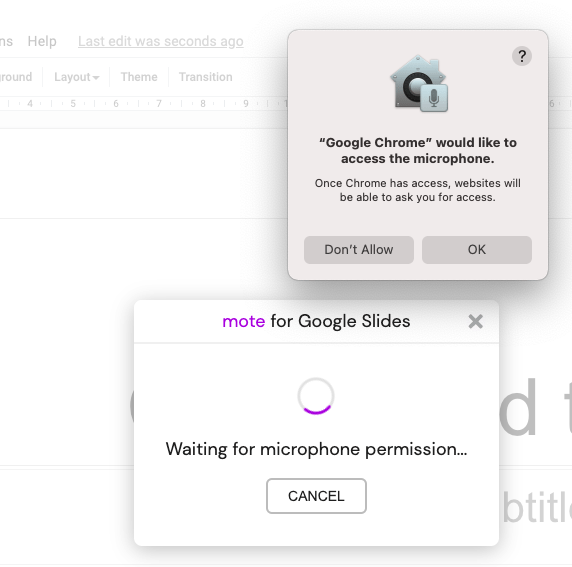
If you’re using a Mac, you will be prompted to allow Google Chrome to access your microphone. Click OK.
The confirmation message below will be displayed when your microphone is connected. Click Next.
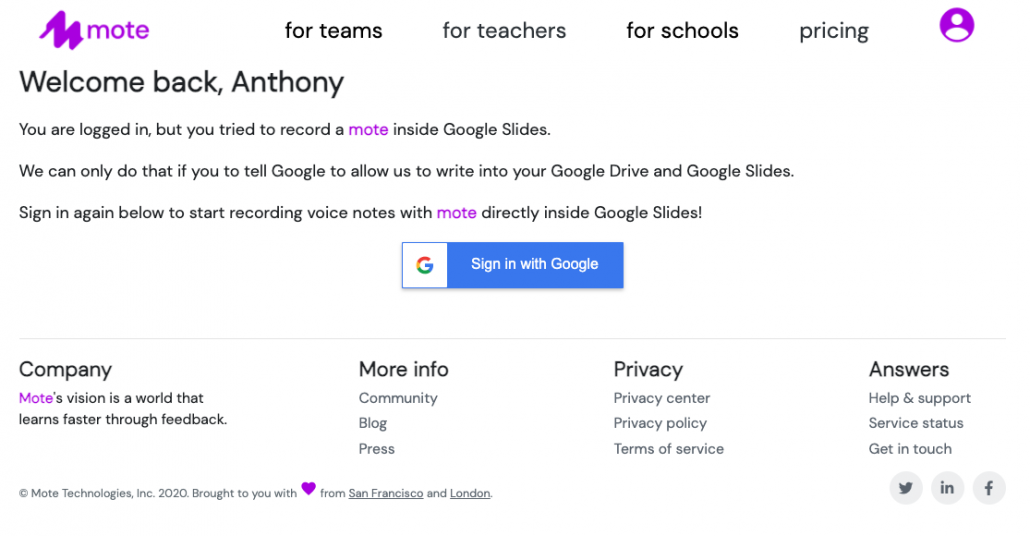
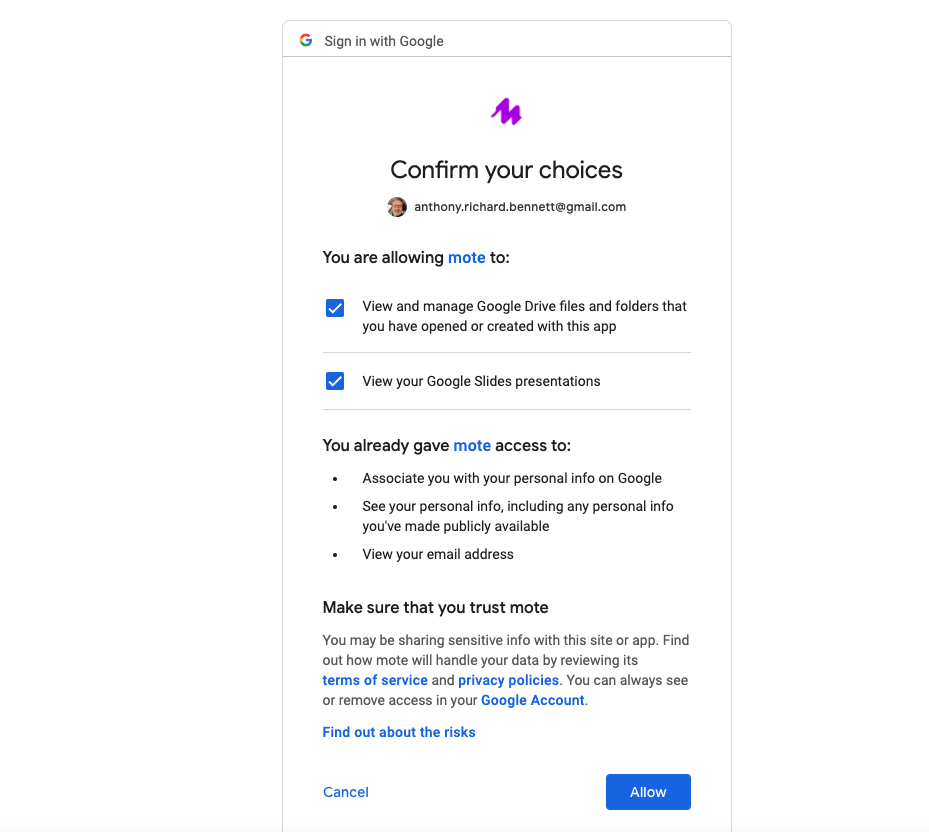
You now need to grant Mote access so Sign in with your Google account.
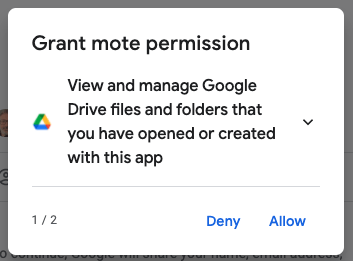
Click Allow to grant permissions.
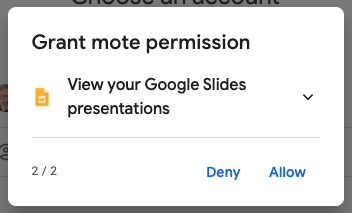
Click Allow.
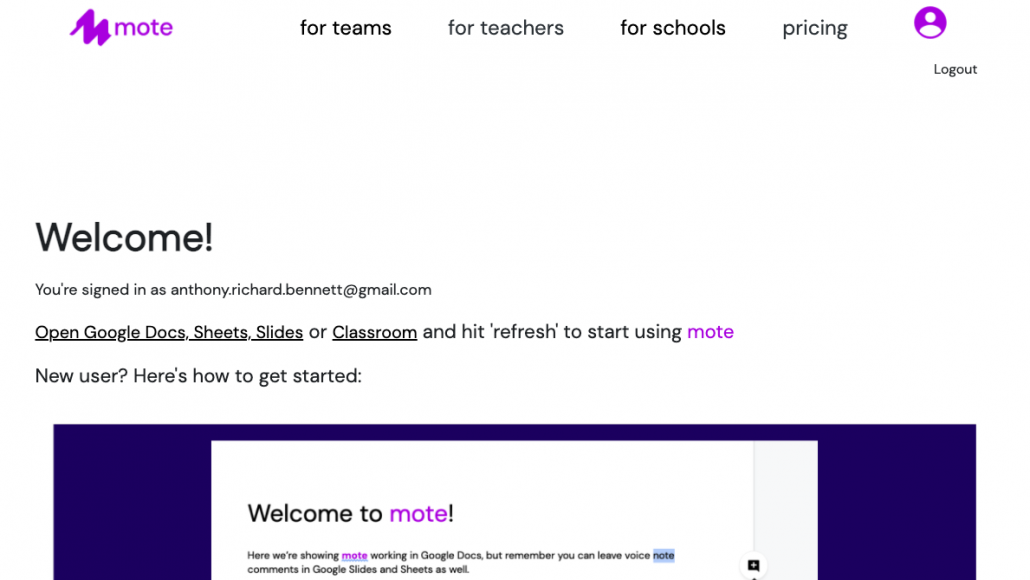
A confirmation message will then be displayed.
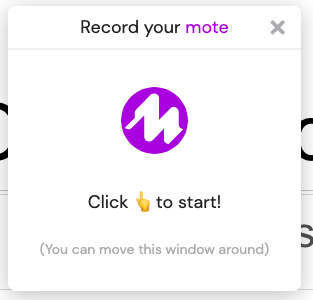
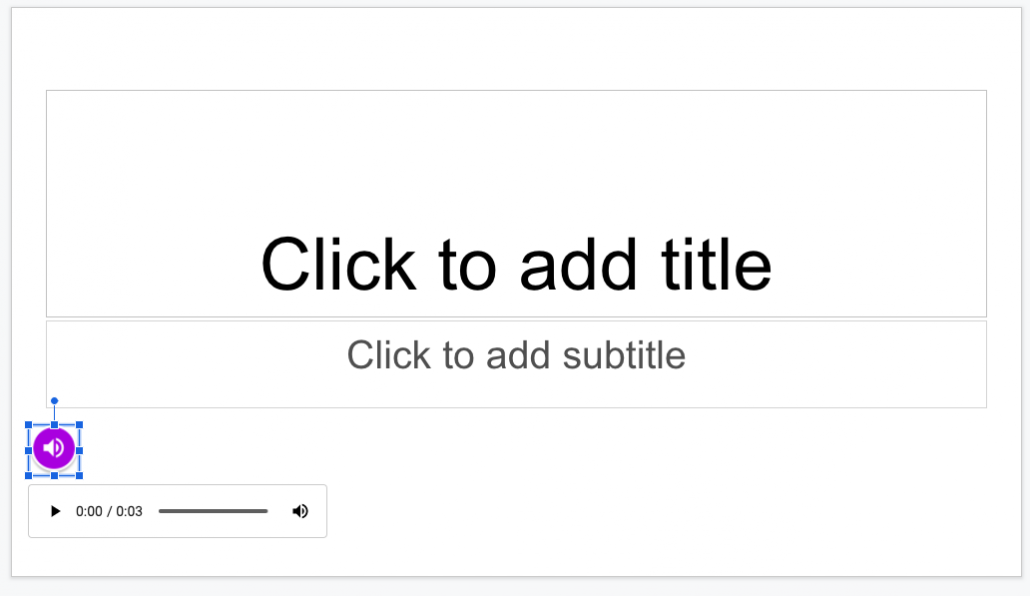
Return to Google Slides, go to the slide you want to add your voice message to and then click the Mote icon. A window, like the one below, will pop-up. Click the icon in the pop-up and record your message.
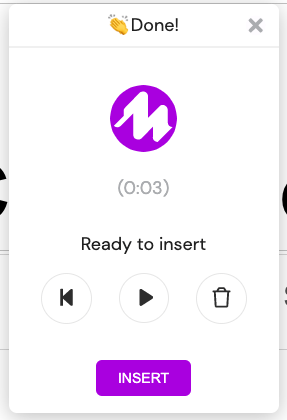
Press the stop button. Then click INSERT.
You can also insert a voice message as a comment. Simply click the comment icon, then click the Mote icon.
https://www.internetgeography.net/wp-content/uploads/2021/01/Setting-up-Mote-1.png404415Anthony Bennetthttps://www.internetgeography.net/wp-content/uploads/2024/01/Internet-Geography-Logo.pngAnthony Bennett2021-01-23 16:38:252026-06-16 15:02:52How do I install Mote to give verbal feedback in Google apps?
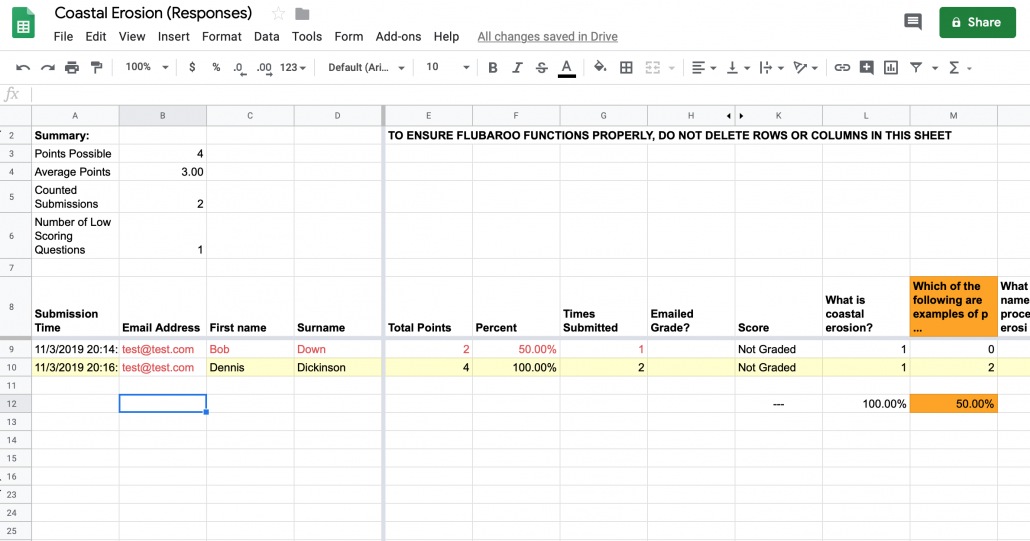
To begin with, we’ll look at a useful plugin to analyse the data generated by students completing a multiple choice quiz. The screenshot below shows an example of what the add-on we will use can do. As you can see, the whole class and individual data is analysed. The question in orange menas less than 60% of students go the answer wrong. Students in red have achieved less than 70%. This feedback can then be used to identify misconceptions or gaps in learning which can then be addressed in class.
Analysis of data
Towards the end of the creating a self-marking quiz using Google Forms guide, we showed you how to create a spreadsheet containing results. As a reminder, simply go to your quiz form and click the Google Sheets icon.
Click the Google Sheets icon
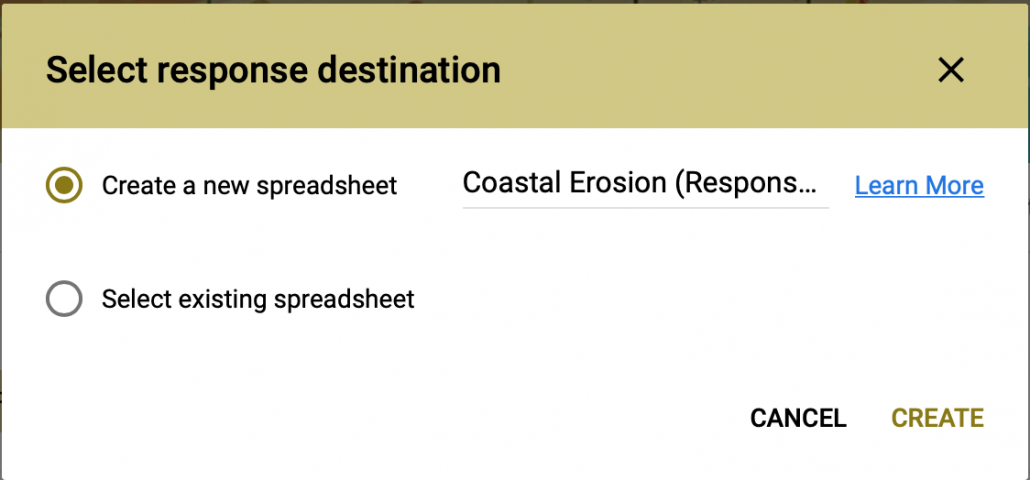
You are then given the option to Create a new spreadsheet or Use and existing spreadsheet. You could either maintain seperate spreadsheets for each quiz or have one dedicated spreadsheet with multiple sheets for your quizzes. This will be a personal choice to do what works for you.
Create a new spreadsheet or Select existing spreadsheet
Once you’ve selected the option, clicking the Google Sheet icon now opens the spreadsheet showing the result. We are now going to install a plug in on your spreadsheet that will automate analysing the results. A plug in is a programme that adds features to your Google Sheet.
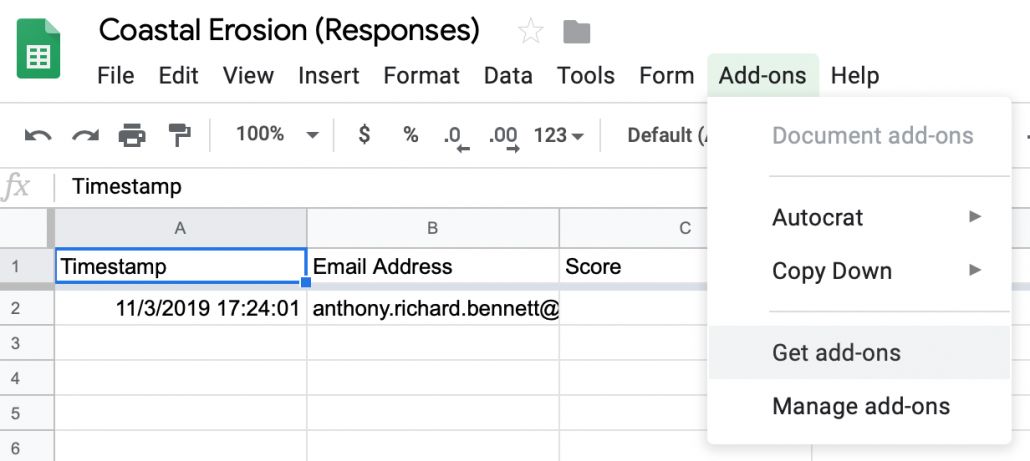
Open your Google Sheet then click Add-ons then Get Add-ons.
Get add-ons
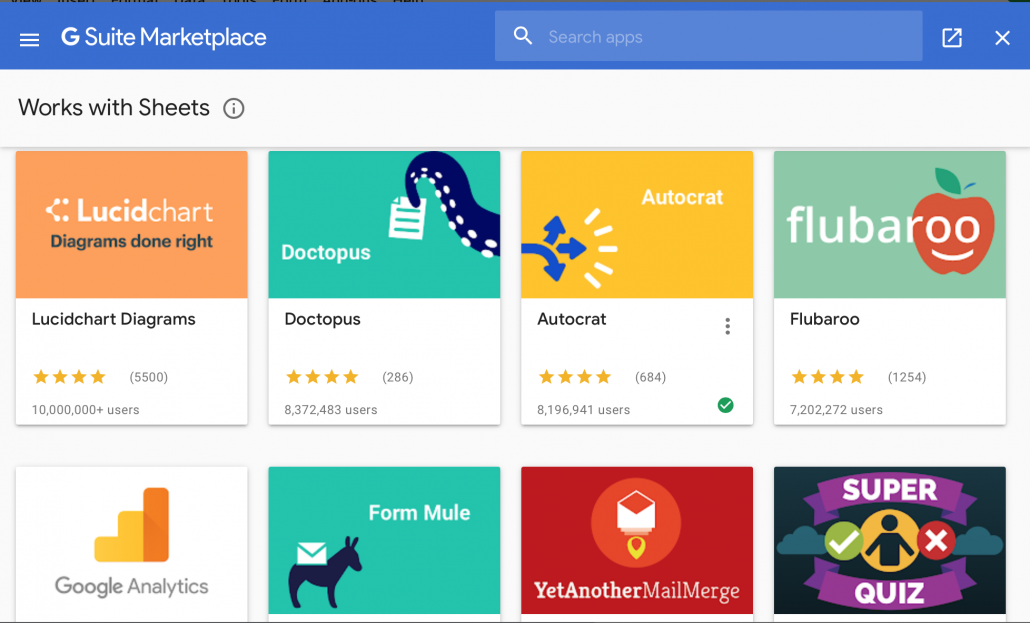
A window will pop-up as shown below. Select flubaroo. If it is not shown in the window then do a search for it. Click the icon, then click Install. Press continue and agree to the terms and conditions. Click done once the plug-in is installed.
Select the flubaroo plug-in
Return to your Google Sheet. You will not notice any difference to the spreadsheet at this stage.
Next, go to the live form and complete it as a student would, ensuring all the correct answers are selected. Be sure to enter your name too, so you can identify this entry later on as the answer key. Click submit.
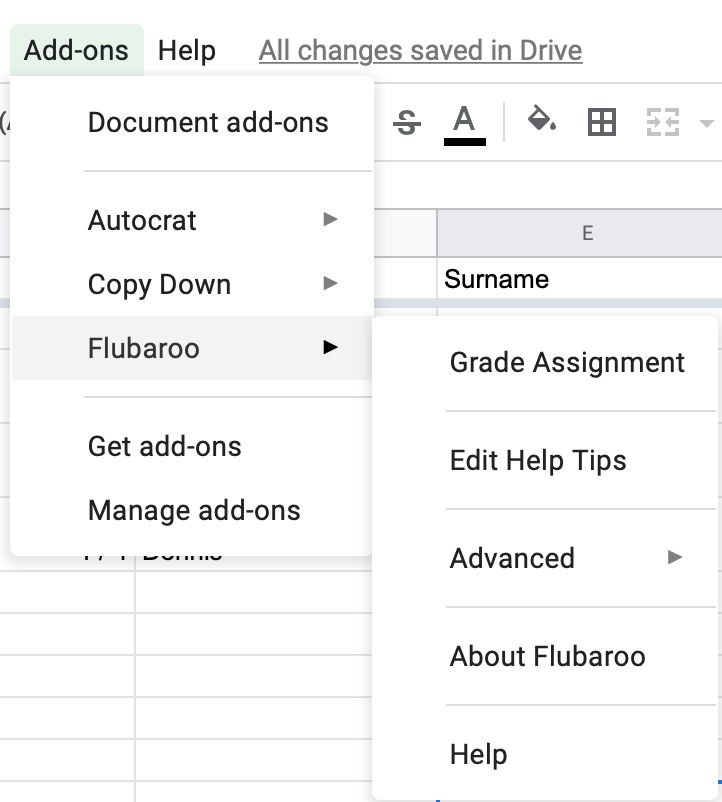
Next, return to your Google Sheet. Go to Add-ons > Flubaroo > Grade Assignment.
Grade assignment
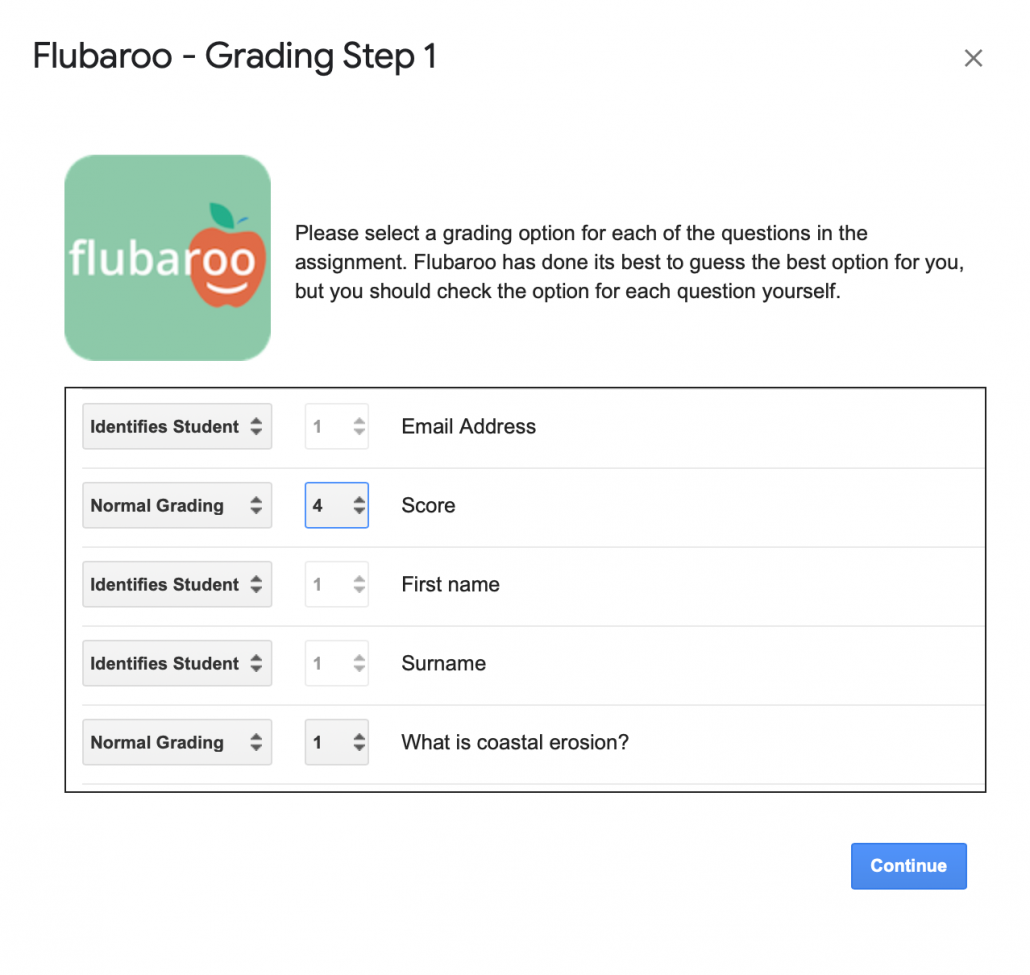
Flubaroo will ask you a few questions, such as:
If any questions should not be graded.
Which questions are for the purpose of student identification (e.g. name, student id, email).
Which submission should be used as the answer key.
Be sure to select skip grading for the score, otherwise this will be added to the scores to the individual questions.
Grading Step 1
Once answered, Flubaroo will grade your assignment. This process should take less than a minute.
A new sheet is created displaying individual and group performance data. If less than 60% of students got a question correct, the question will be highlighted in orange to alert you. Additionally, students who scored less than 70% on the assignment will be highlighted in red.
https://www.internetgeography.net/wp-content/uploads/2019/11/Analysis.png8411600Anthony Bennetthttps://www.internetgeography.net/wp-content/uploads/2024/01/Internet-Geography-Logo.pngAnthony Bennett2019-11-04 19:47:262019-11-04 21:06:02Analysing data from a self-marking quiz using Google Forms with Flubaroo
Creating a self-marking quiz using Google Forms is easy. Not only can students complete the quiz using any device but the quiz is self-marking, saving you time. This tutorial takes you through the steps needed to create a quiz like this basic example for coastal erosion.
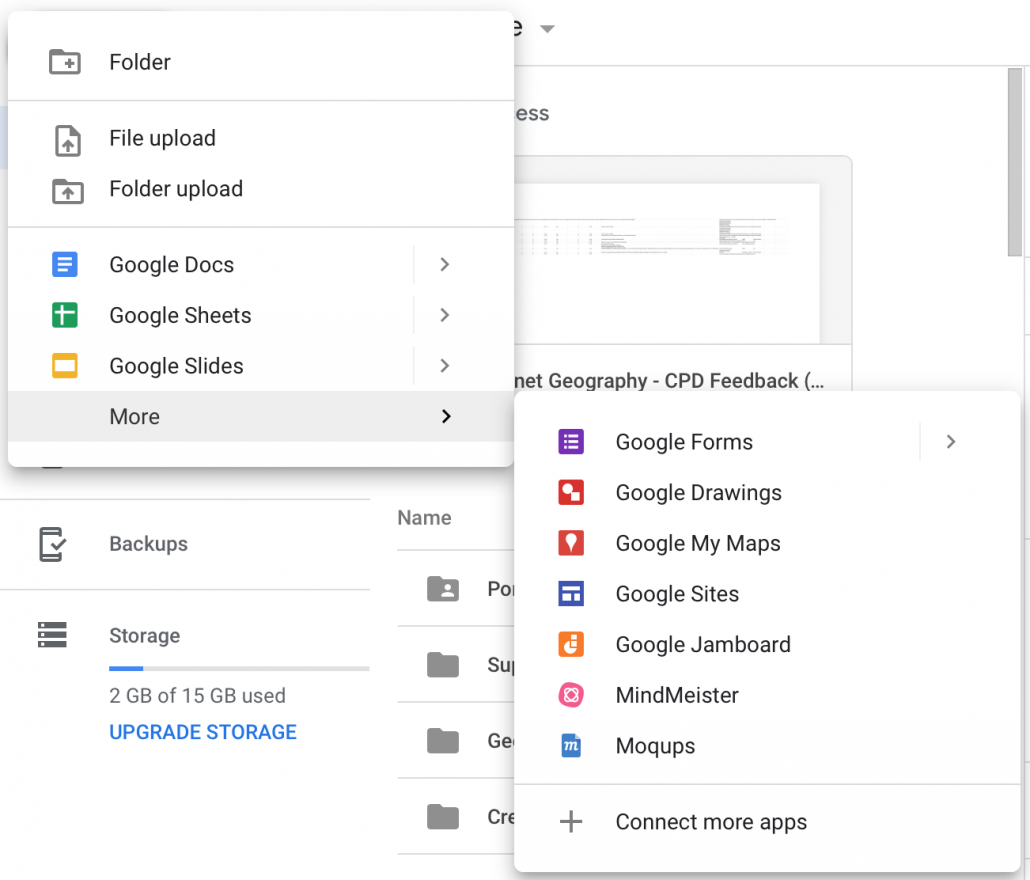
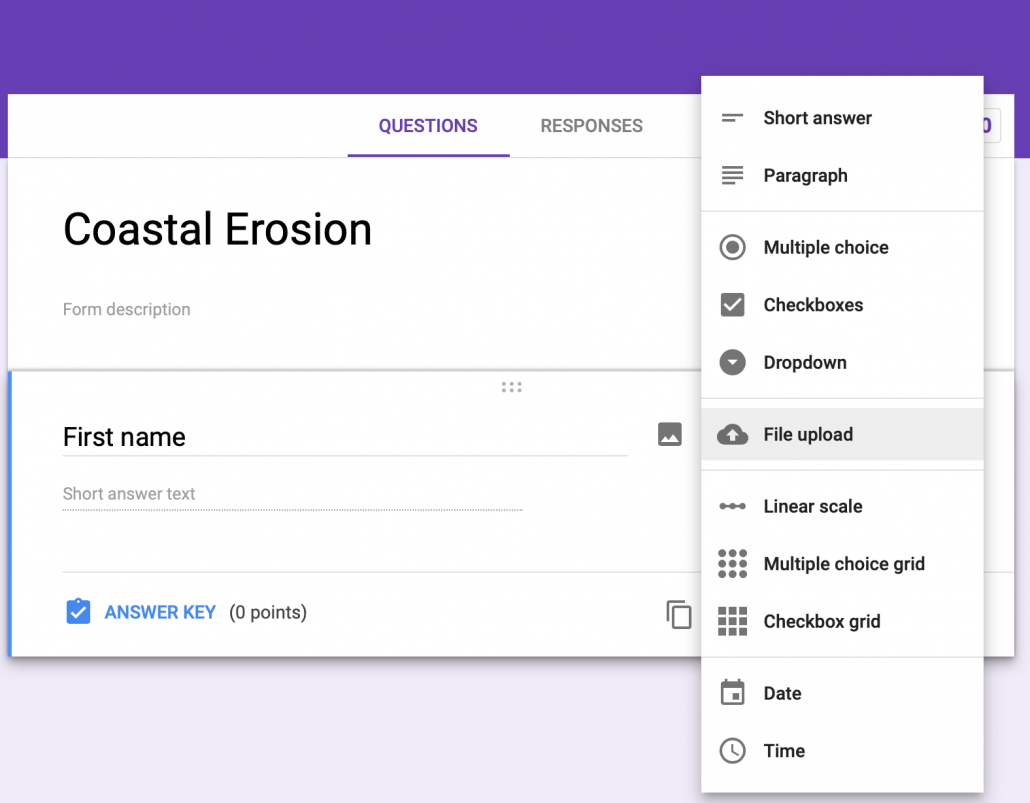
To get started, head over to your Google Drive and click the New button in the top left corner. Next, click More then click Google Forms.
Open Google Forms
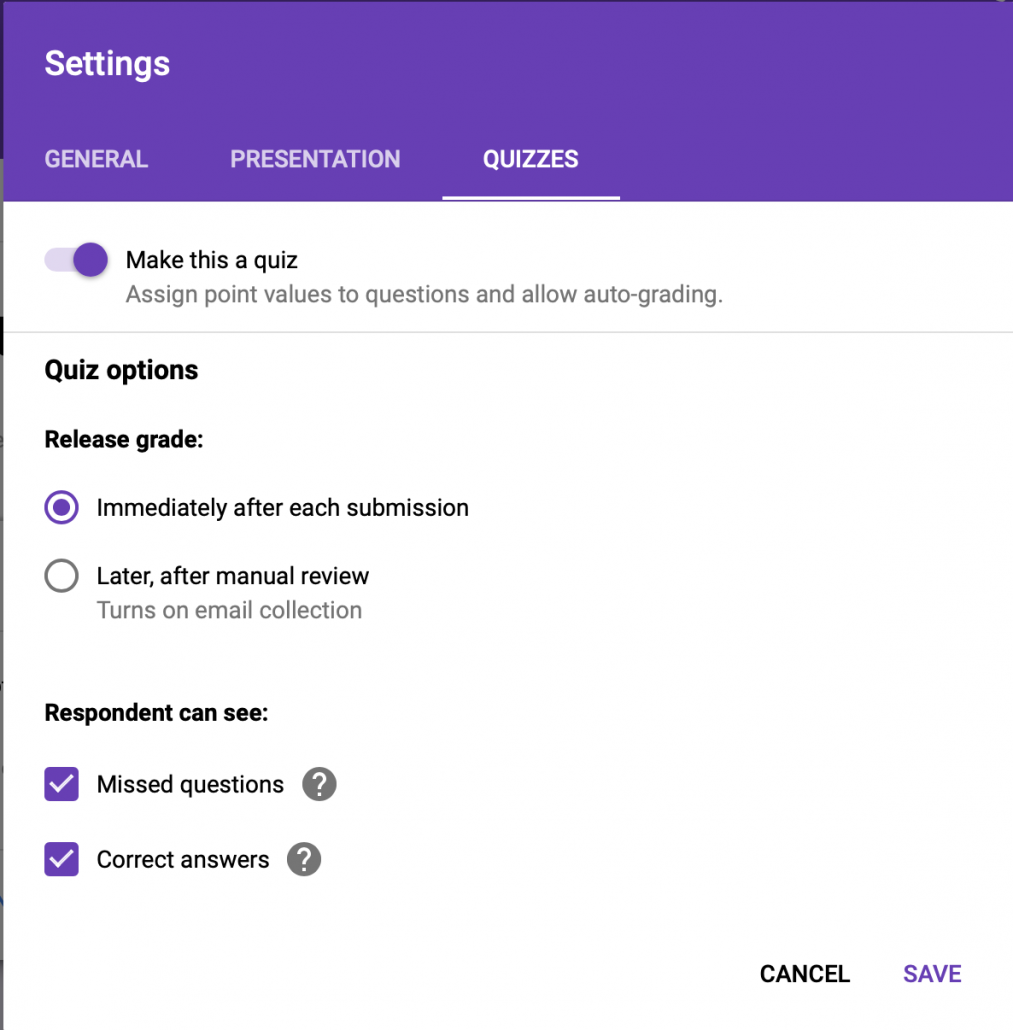
When your form is open, click the settings icon (cog) then select the Quizzes tab. This allows you to allocate points to the quiz and allow grading should you want it. Next, click Save.
Turn on quiz
Give your quiz a title, by clicking Untitled form and adding a title.
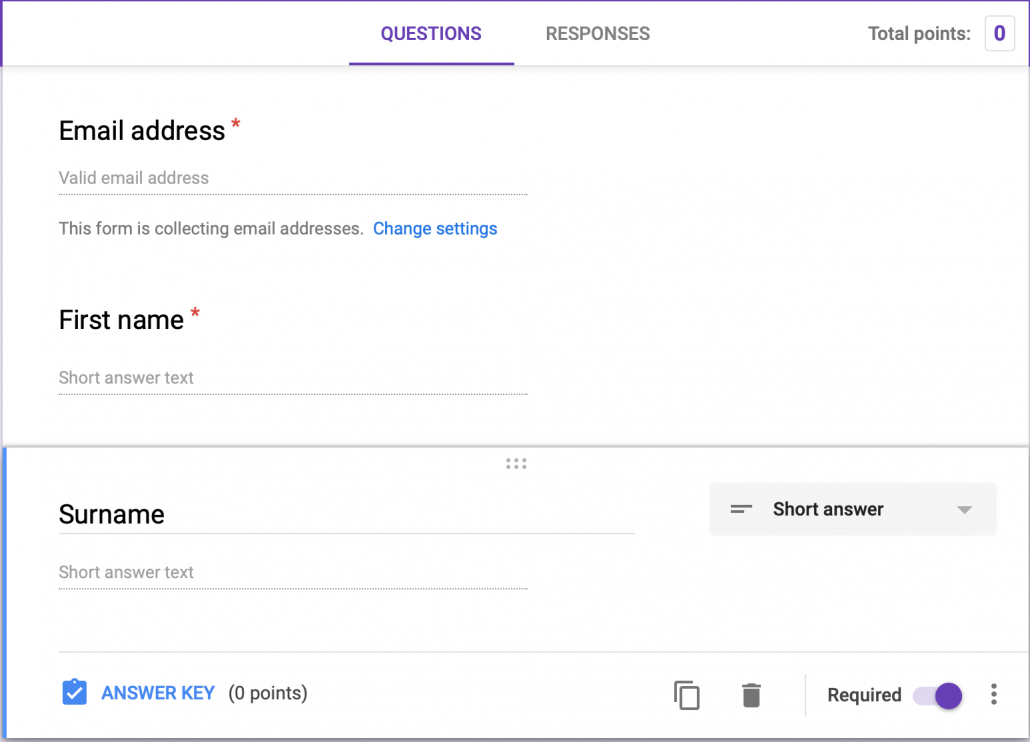
You now need to add fields to your quiz, which can include first name, surname and email address. To begin with type first name into the first question field. Then, select short answer from the answer dropdown. Make sure you click the required slider otherwise students could submit a quiz without adding their name. You can duplicate the question to add surname and email address.
Adding name fields
When you’ve added the email address field you will have the option to collect email addresses. Click the link to enable this.
Your form will look something like the example below.
Collecting details for your quiz
Next, you need to add your questions. You can add multiple choice questions, multiple answer questions and short answers.
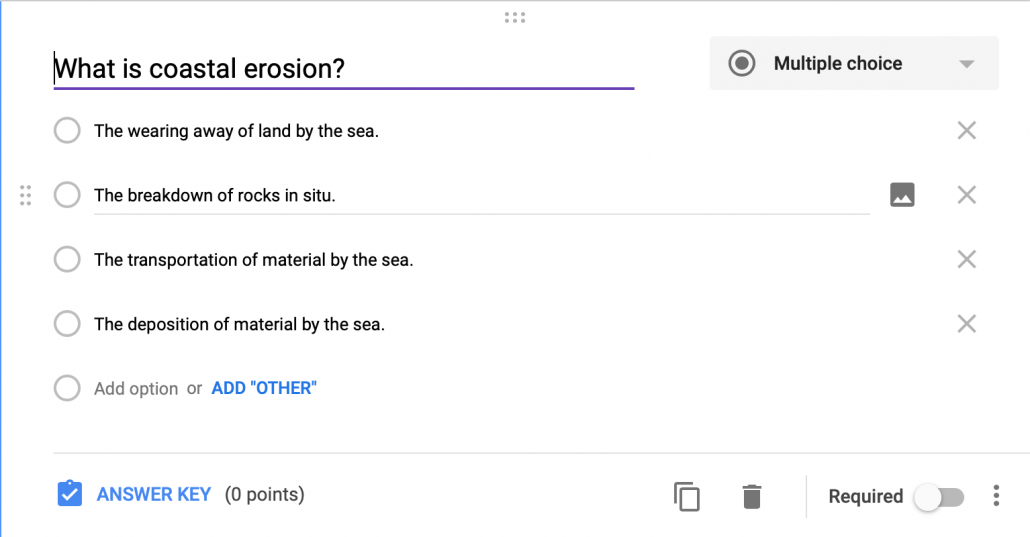
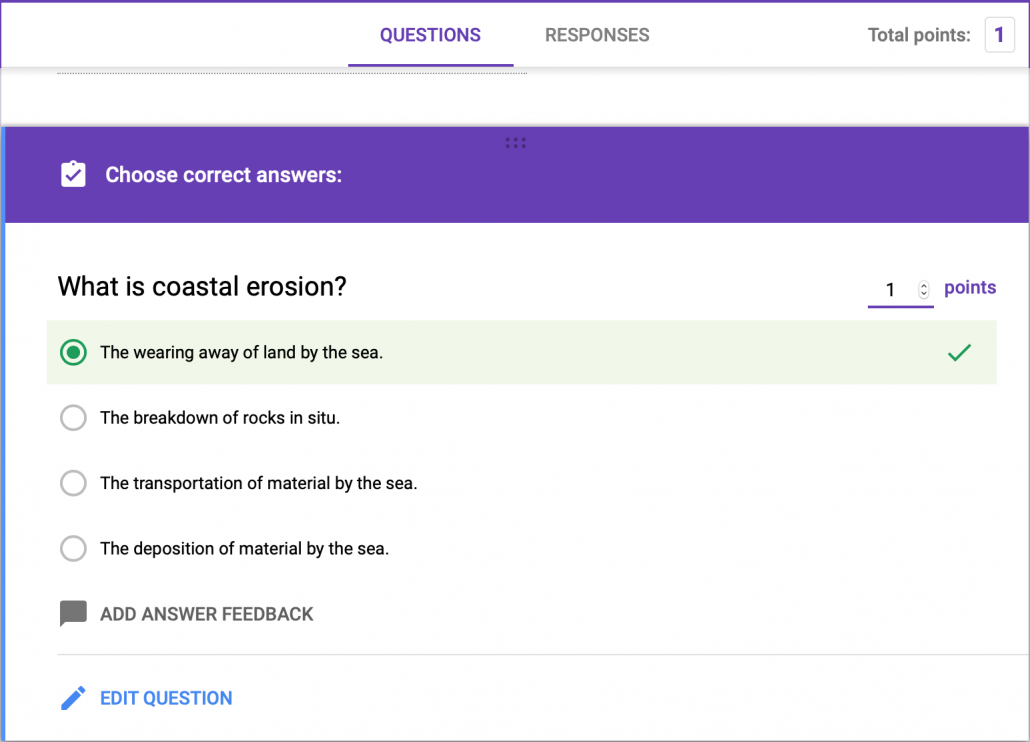
Below is an example of a multiple-choice question. Remember to select Required so that students ahve to answer the question.
Example multiple-choice question
Once your written your multiple-choice question, click ANSWER KEY. Next, identify the correct answer and allocate the number of points available for correctly answering it. You can choose to add answer feedback too if you wish to.
Identify the correct answer and allocate points
Add the remaining questions you want to ask.
When you are ready to test your quiz click the preview icon at the top of the screen. This will take you to the live quiz (you can copy the web address and share it with students – if you are not sharing this electronically you might want to shorten the web address (URL) by visiting TinyUrl.
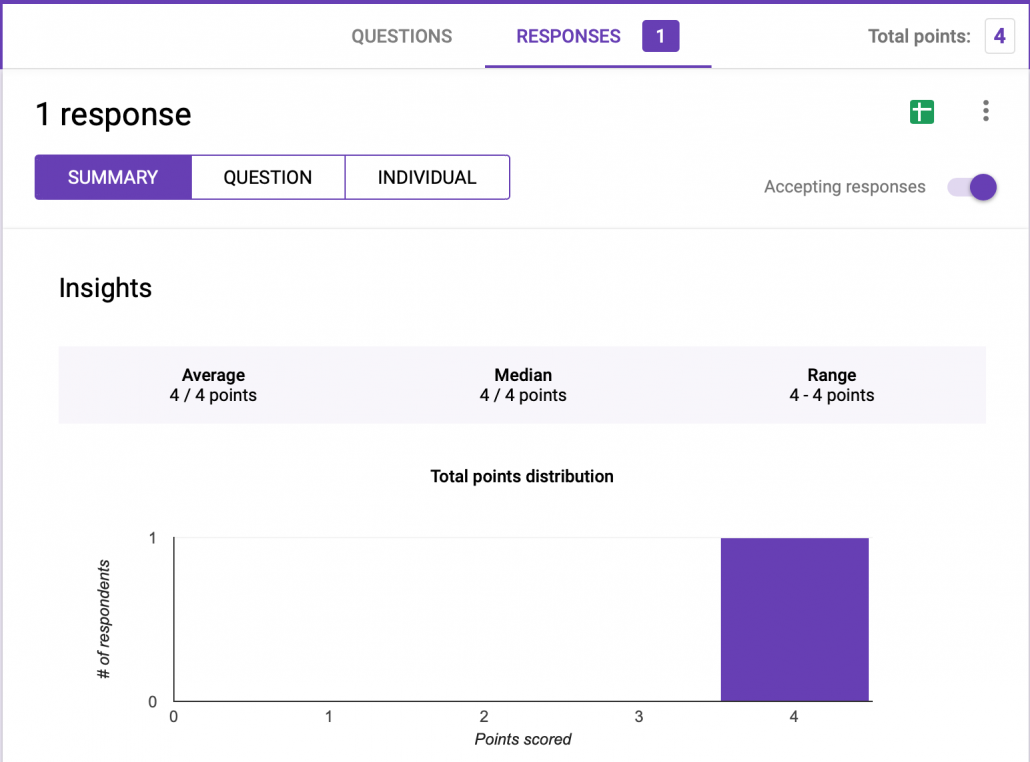
Once you have shared the quiz you can check results by clicking the Responses tab. You can review the performance of your students by exploring the options. If you want the results in a spreadsheet format, just click the Sheets icon below Total points. This will create a spreadsheet containing all the responses.
Responses
Did you know? If you subscribe to Internet Geography Plus you’ve got access to a number of multiple-choice question booklets. You can copy and paste questions and answers from these booklets to create digital versions of the multiple-choice resources. Please note, if you use our questions please don’t share the quizzes with people or students outside of your classes if you have an individual subscription or your school if you have a department subscription.
https://www.internetgeography.net/wp-content/uploads/2019/11/Adding-name-fields.png12281576Anthony Bennetthttps://www.internetgeography.net/wp-content/uploads/2024/01/Internet-Geography-Logo.pngAnthony Bennett2019-11-03 17:37:262026-06-16 15:08:07Create a self-marking quiz using Google Forms
Using Google Images and Google Maps you can easily create a map using an album of geotagged photos. Geotagged photos are those that include data on the location they were taken. Most modern mobile phones have this feature as do some digital cameras. If you are not sure a quick search on the Internet will tell you if this option is available and how to enable it.
Below is a map showing the location of a number of images taken in and around Hornsea on the Holderness Coast using an iPhone and a drone.
Looks complicated? Don’t worry, it’s not! Just follow the steps below.
To begin with, you will need to upload your geotagged photos to a new album in Google Photos. To do this login to your Google account and go to https://photos.google.com. Next create a new album by clicking +Create in the top right corner, then select Album.
Give the folder a title then upload the images you want to map.
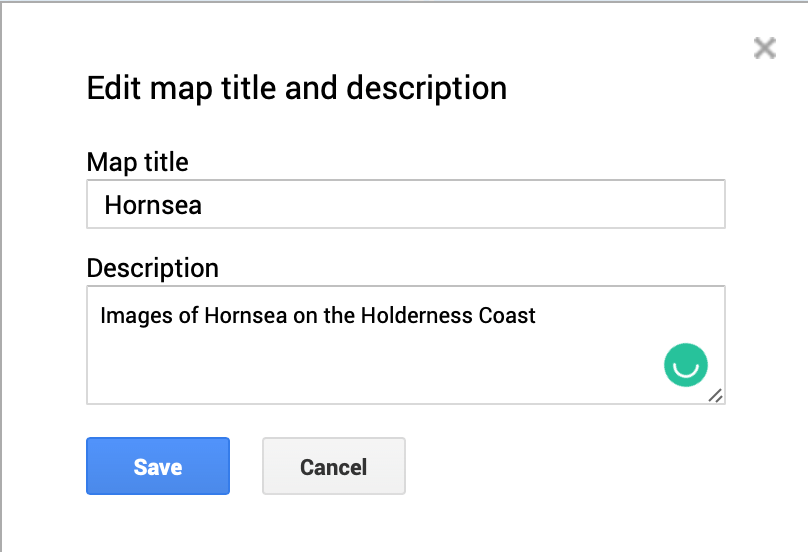
Next, go to https://www.google.com/maps/d/ and select +Create New Map (top left corner). Your new map will open and be called Untitled map. Give your image a suitable title by clicking untitled map in the top left window.
Rename your map.
Click Save.
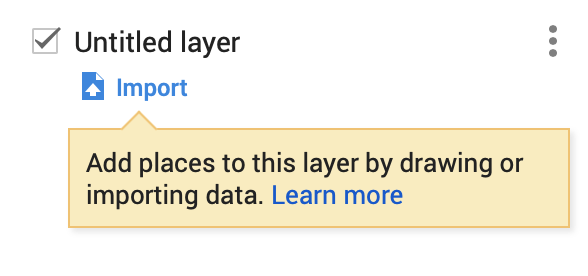
Next click Import (under the first layer which is called Untitled layer).
Click Import
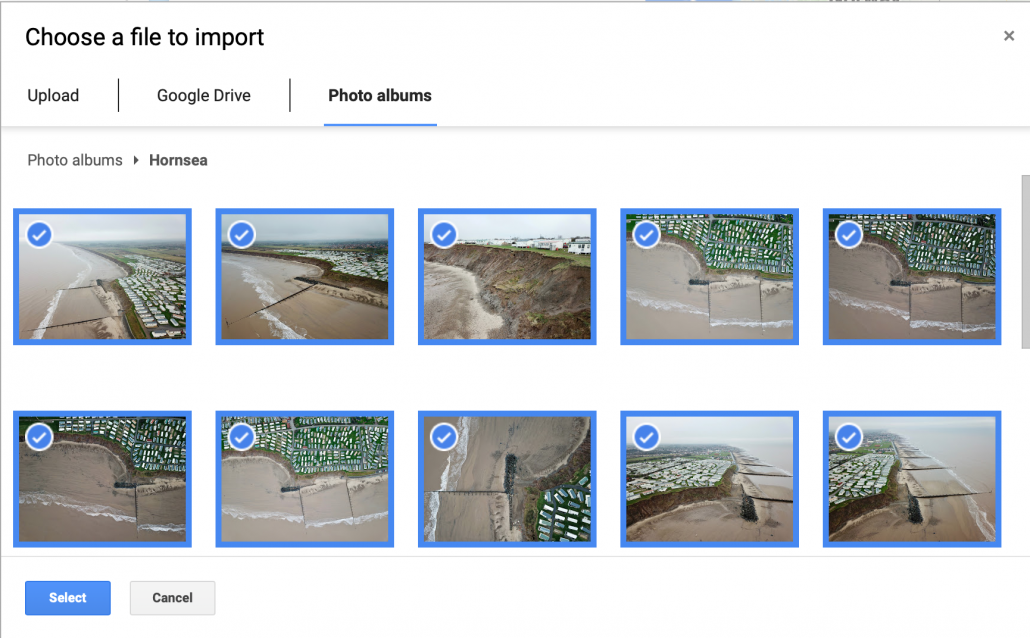
Click the Photo albums tab. Next, locate the album where your photos are stored. Select all the images you want to import onto the map.
Select images you want to import
Next, click Select. The photos will then be copied onto your map.
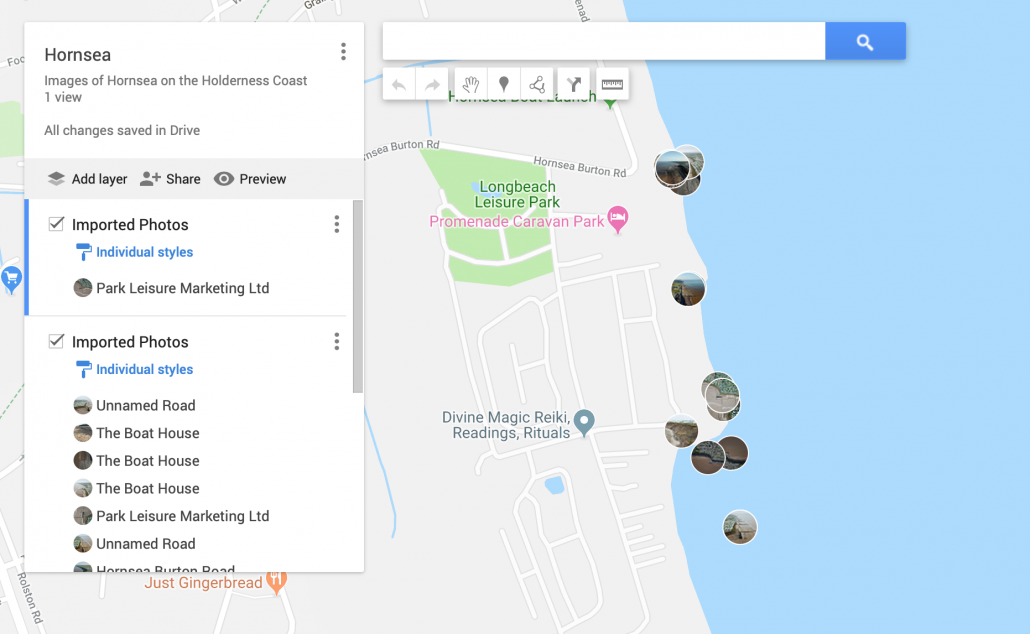
This will create at least one layer containing your images and an icon of each image will be displayed on the map.
Imported images and new layers
You will notice that each photograph has been given a title based on the location it was taken. You should go through these and rename them as appropriate. Once you’ve finished you can share your map with others by clicking Share > Change > On. You can then share the URL. You can also embed the map on a website by clicking the three dots next to the map title. Then select Embed on My Site.
https://www.internetgeography.net/wp-content/uploads/2019/02/Imported-images.png9851600Anthony Bennetthttps://www.internetgeography.net/wp-content/uploads/2024/01/Internet-Geography-Logo.pngAnthony Bennett2019-02-01 18:41:022026-06-16 15:32:38Map your photos using Google Maps
https://www.internetgeography.net/wp-content/uploads/2018/06/Interactive-proportional-circles-map.png7201176Anthony Bennetthttps://www.internetgeography.net/wp-content/uploads/2024/01/Internet-Geography-Logo.pngAnthony Bennett2018-06-26 15:01:582026-06-16 15:37:05Create a proportional circles map in Google Sheets
https://www.internetgeography.net/wp-content/uploads/2018/06/google-for-eduction.png512512Anthony Bennetthttps://www.internetgeography.net/wp-content/uploads/2024/01/Internet-Geography-Logo.pngAnthony Bennett2018-06-26 09:05:042018-06-26 15:03:10Reasons to use Google Drive in your Geography Classroom
https://www.internetgeography.net/wp-content/uploads/2018/06/Hover-over-a-country.png8321282Anthony Bennetthttps://www.internetgeography.net/wp-content/uploads/2024/01/Internet-Geography-Logo.pngAnthony Bennett2018-06-25 15:56:532026-06-16 15:37:30Create a choropleth map in Google Sheets