Google My Maps Project – Mapping my local area
In this lesson, you will map land use in your local area. To do this you need a Google account. If you don’t have one through school, simply head over to Google.com and click the sign-in button. Then click create an account. Go through the process of setting up an account.
What is land-use?
Land use is the function of land – what it is used for. Land use varies from area to area. In rural areas (countryside) land use can include forestry and farming. In urban areas (towns and cities) land use can include residential and business.
Land in urban areas is used for many different purposes:
- leisure and recreation – may include open land, e.g. parks or built facilities such as sports centres
- residential – the building of houses and flats
- transport – road and rail networks, stations and airports
- business and commerce – the building of offices, shops and banks
- industry – factories, warehouses and small production centres
In rural areas land can be used for:
- agriculture – growing crops and rearing animals
- forestry – growing trees
- military training
- recreation
- water supply
- mining
- quarrying
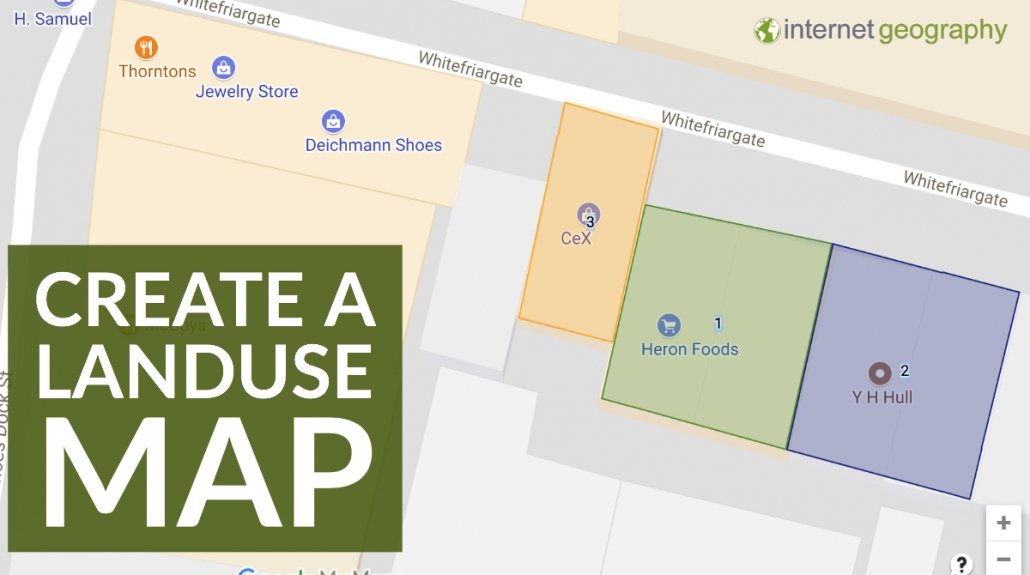
The Challenge
Your challenge is to map land use in your local area. You will use online satellite images and maps to create a land-use map of your local area. Below is a step-by-step guide on how to create a land-use map in Google Maps.
- Go to Google My Maps
- Click Create A New Map
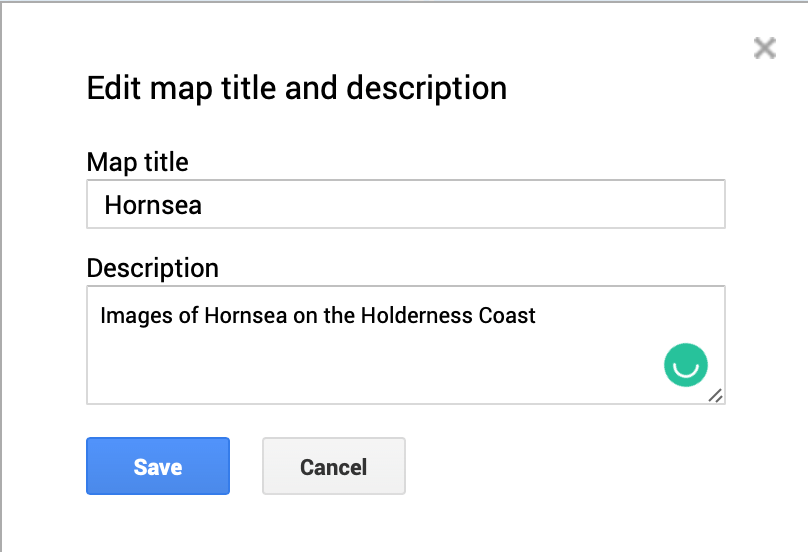
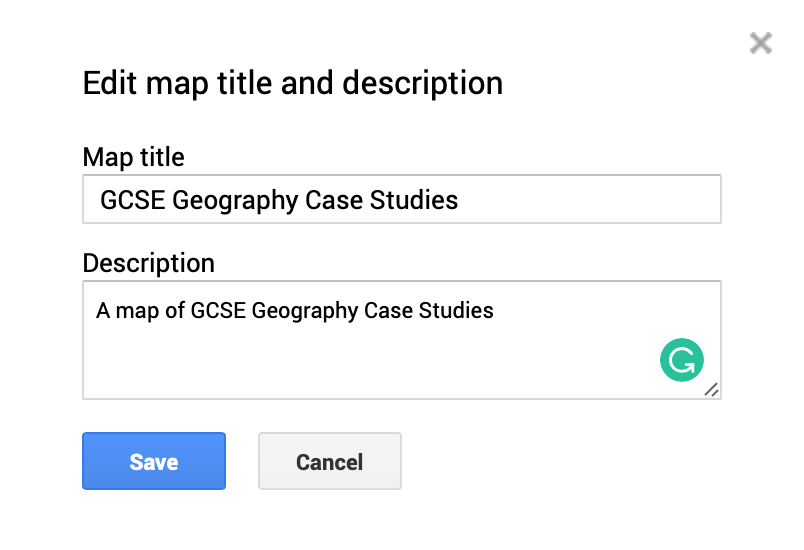
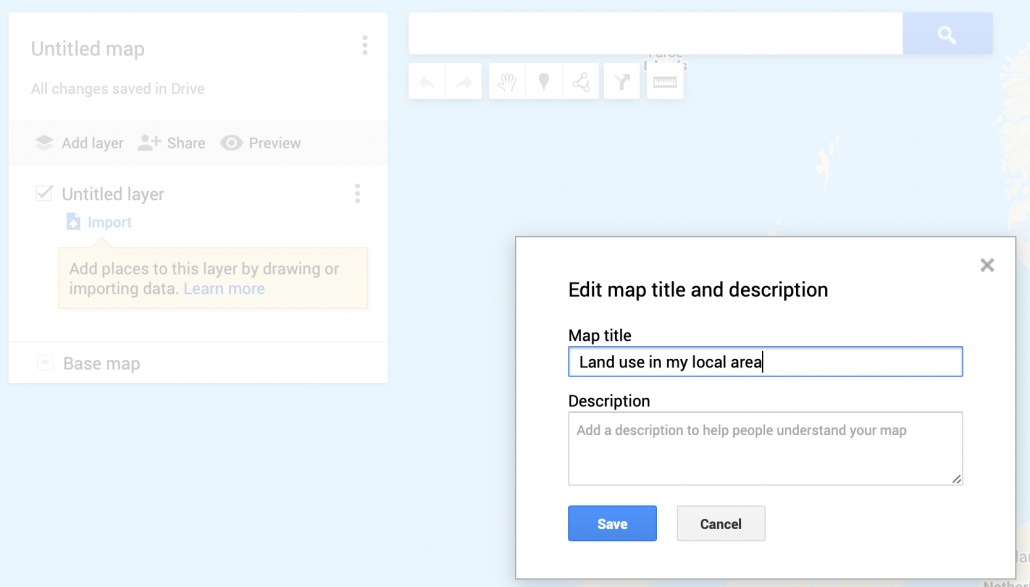
- Click Untitled Map (top left corner) and give your map an appropriate title e.g. land use in my local area.

Naming your map in Google My Maps
- Next, find your local area by typing in the name of your street in the search box. When it is displayed, click it, then the map will zoom into your local area.
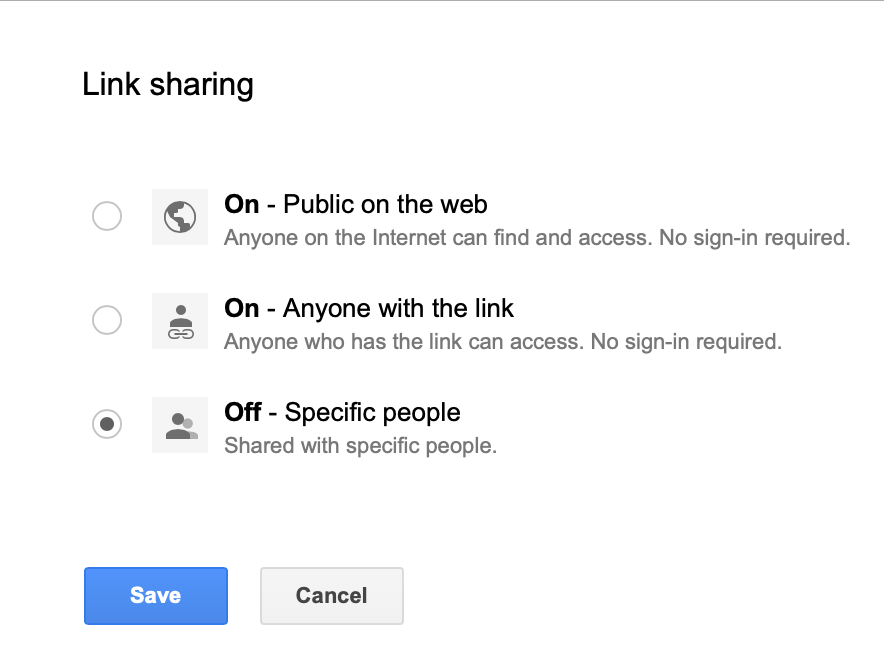
- You can share your map and work with other students at the same time. To do this click Share, in the Add people box add the email address of the person you want to share the map with. Then click send.
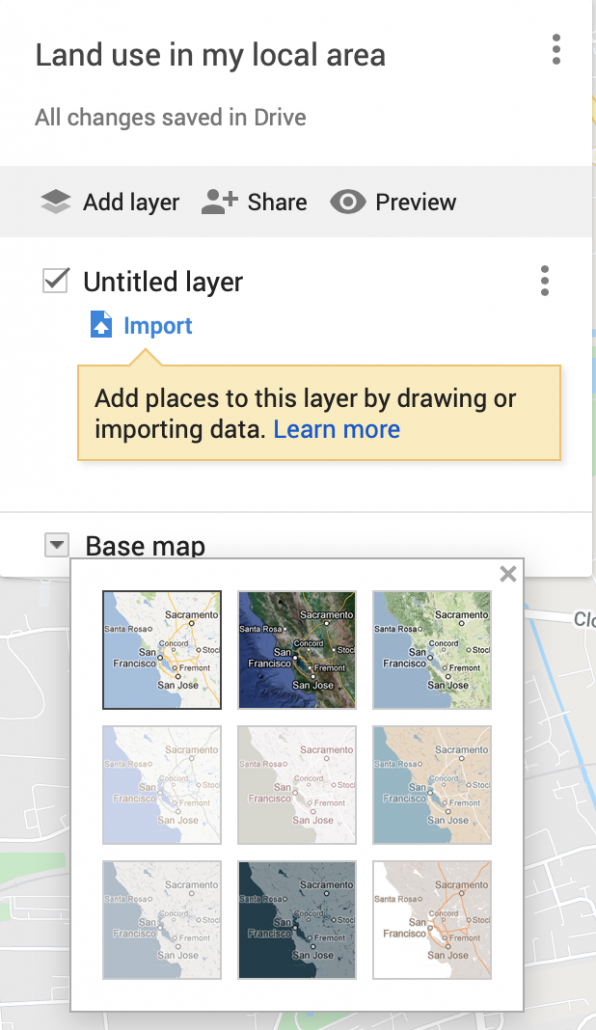
- You can switch between the map view and other views, including satellite images, by clicking the drop-down menu next to Base Map. This will help when looking at different land uses.

Choosing a base map
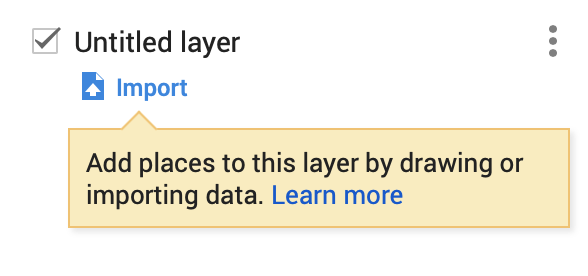
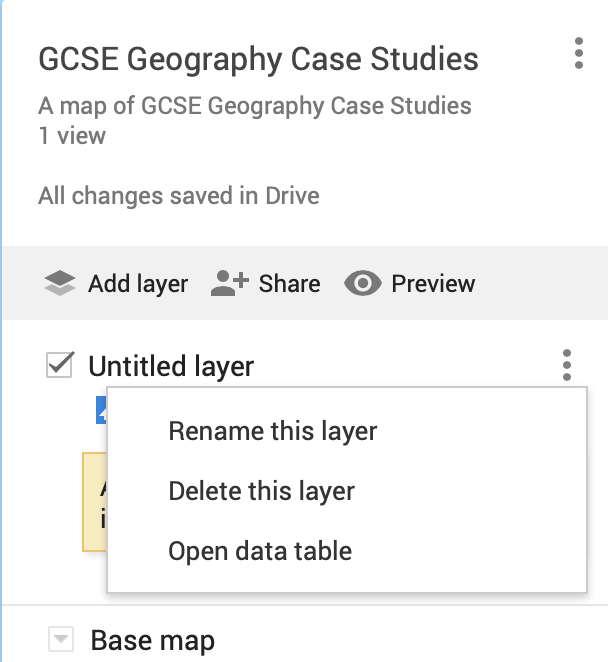
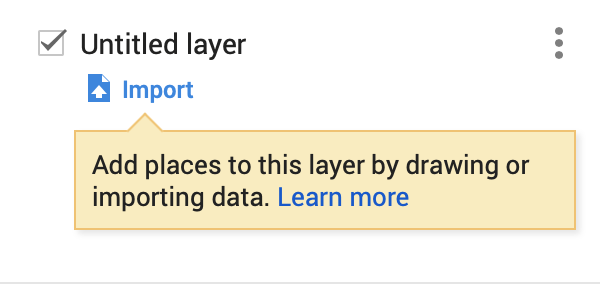
- You can use layers to on your map to organise different features e.g. one layer for residential (housing) areas and another for industry (e.g. factories). You now need to create layers for each different land use that you can include on your map.To do this you need to start by naming the first layer that is already on your map. This is currently called Untitled Layer. Click this and name it Leisure and Recreation.

Naming a layer
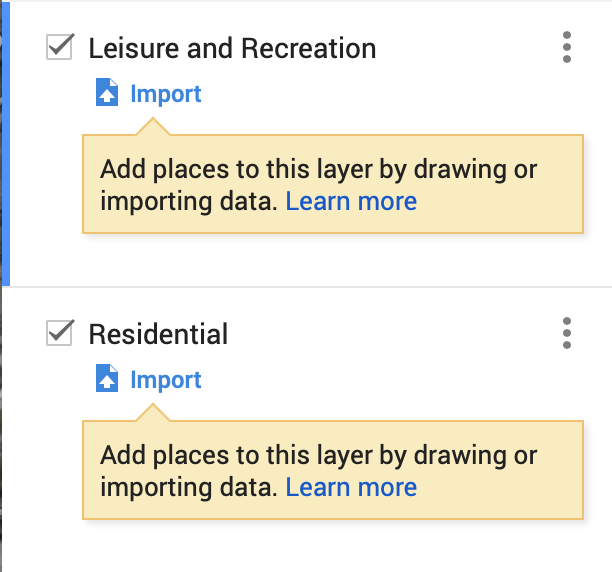
- Next, click add layer and name this layer Residential.
- Repeat this until all the land use types are included from the list at the top of the page.
- You are going to use the polygon tool to draw shapes over land use areas on your map. To get started, find an area of the same land use in your local area e.g. a housing estate, industrial area, shops etc. Click on the correct layer e.g. residential to map an area of housing, so you can draw on it. The layer will have a blue line next to it to show you have selected it. In the example below the Leisure and Recreation layer has been selected.

Selecting a layer
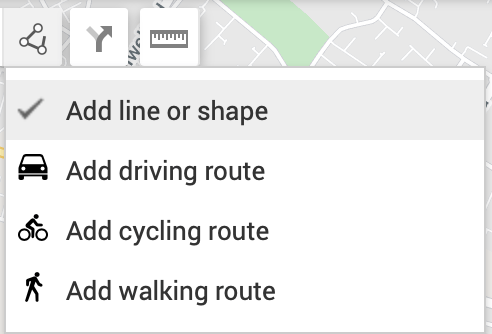
Next click on the Draw a line icon and select Add line or shape.

Draw a line tool
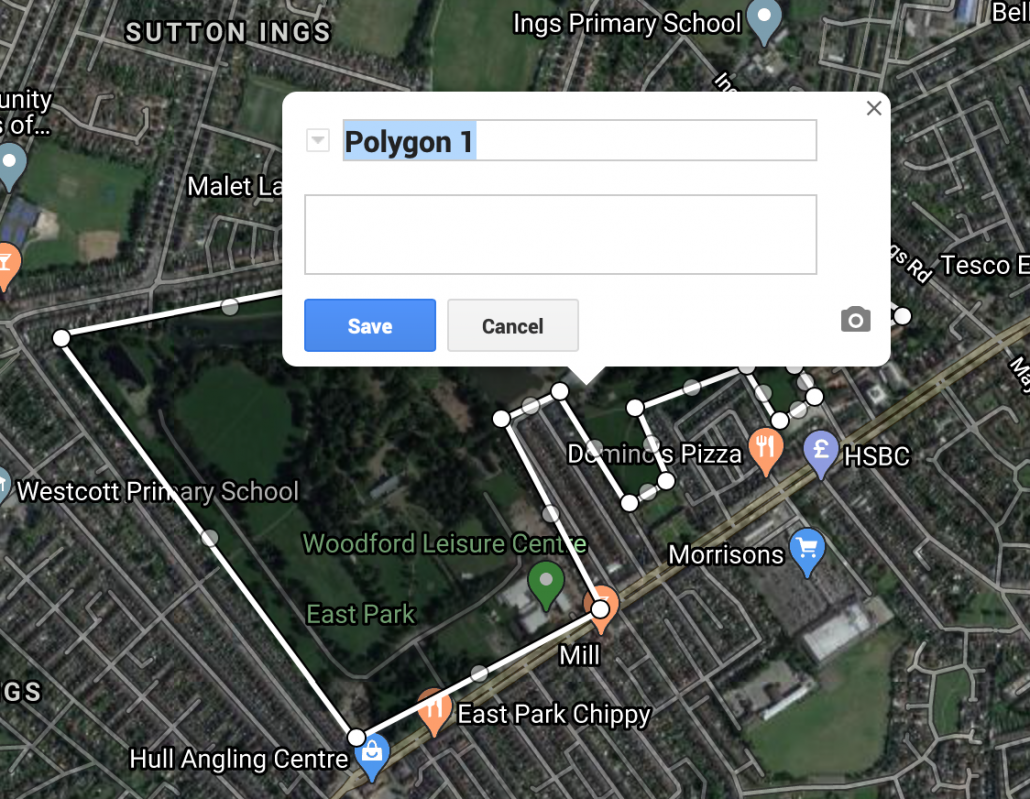
Next, draw a polygon around the area you are going to map. To do this click every time you get to a corner. The final click should be on the dot where you started. In the example below a polygon has been drawn around a public park. You will notice it is called Polygon 1. The layer needs renaming to something such as a public park.

Drawing a polygon
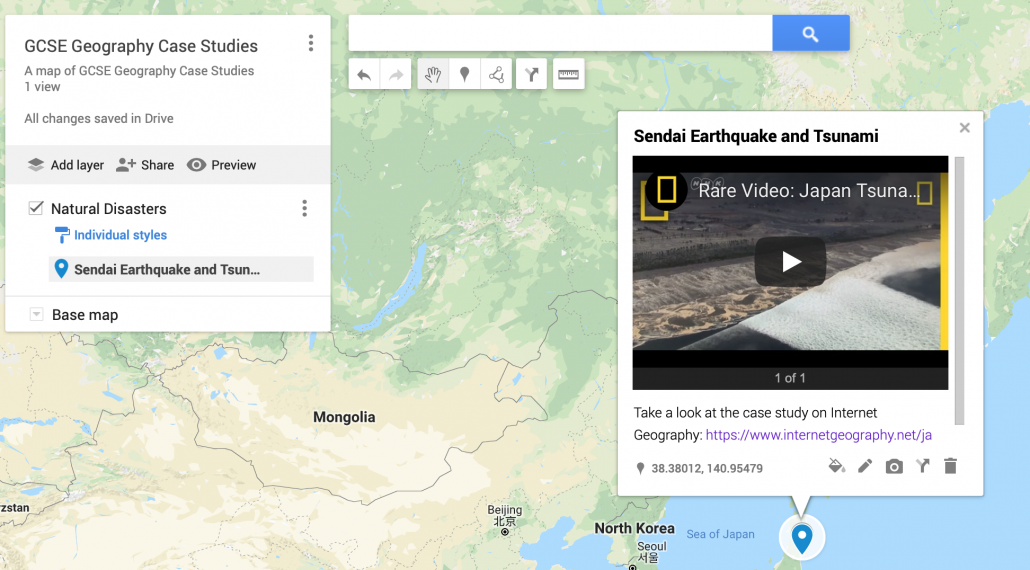
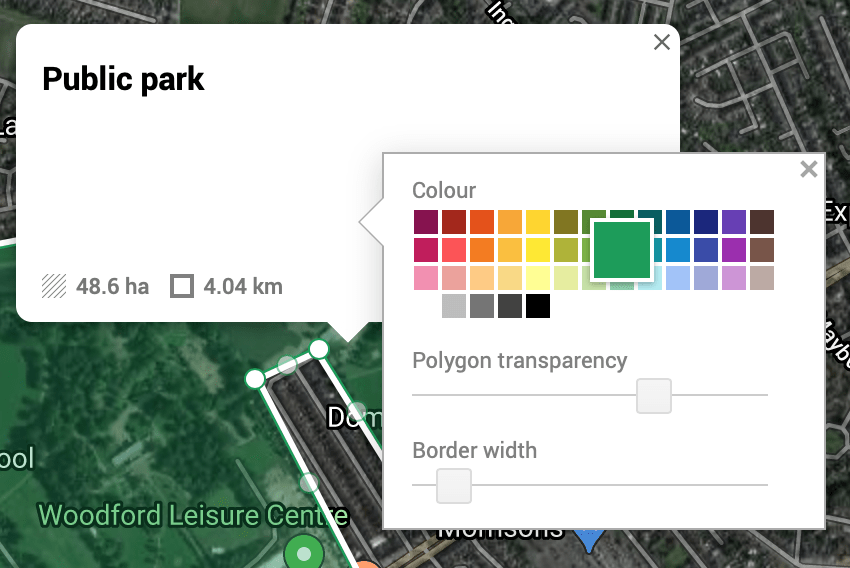
- Next, click the fill button and select a colour you will use for all areas of Leisure and Recreation on your map. In the example below, Leisure and Recreation have been filled green.

Fill a polygon
- As you can see in the image above the park covers an area of 4.04k㎡
- Spend some time exploring your local area on the map and add any other Leisure and Recreation in the area in the same way as above. Remember to fill the polygons the same colour.
- Once you have done this, click on the next layer e.g. Residential, and map the housing in your local area.
- Repeat this for all other land uses in your local area.
Taking it further
Compare land use in your local area. This could include adding together the total area of land covered by each land use. You could present this on a graph and describe what the data shows.