8 ways to use Google Maps in geography
Google Maps has been around for over 10 years now. The free GIS software is easy to use and allows students to collaborate in real-time. We’ve pulled together 8 ways of using Google My Maps in the classroom.
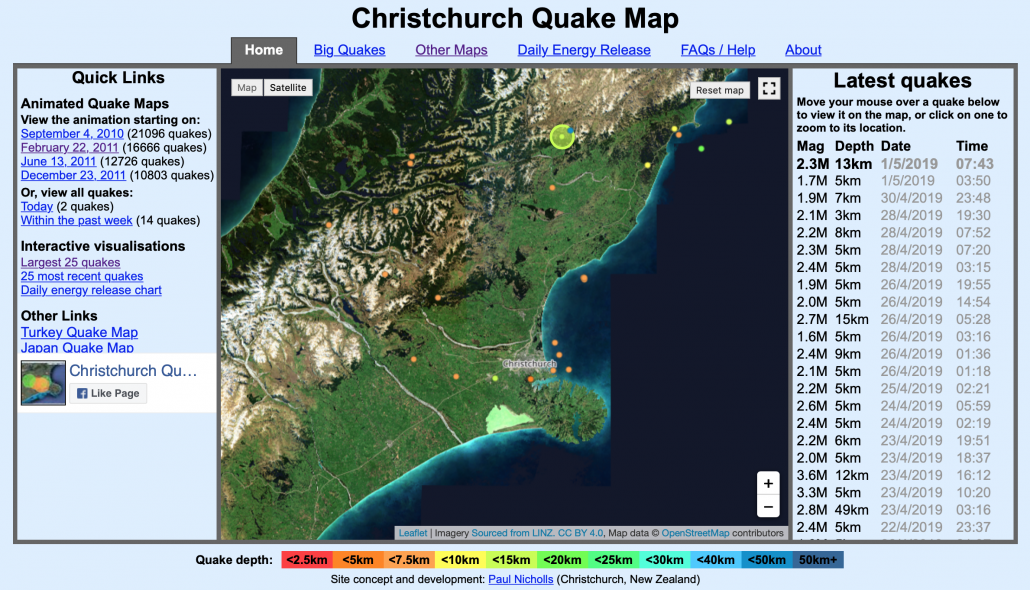
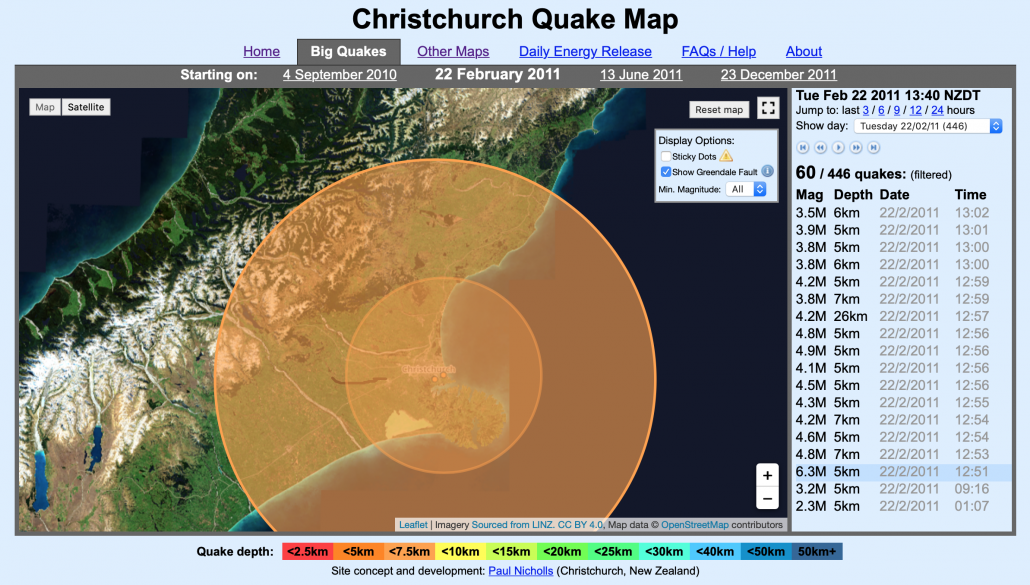
1. Case study maps
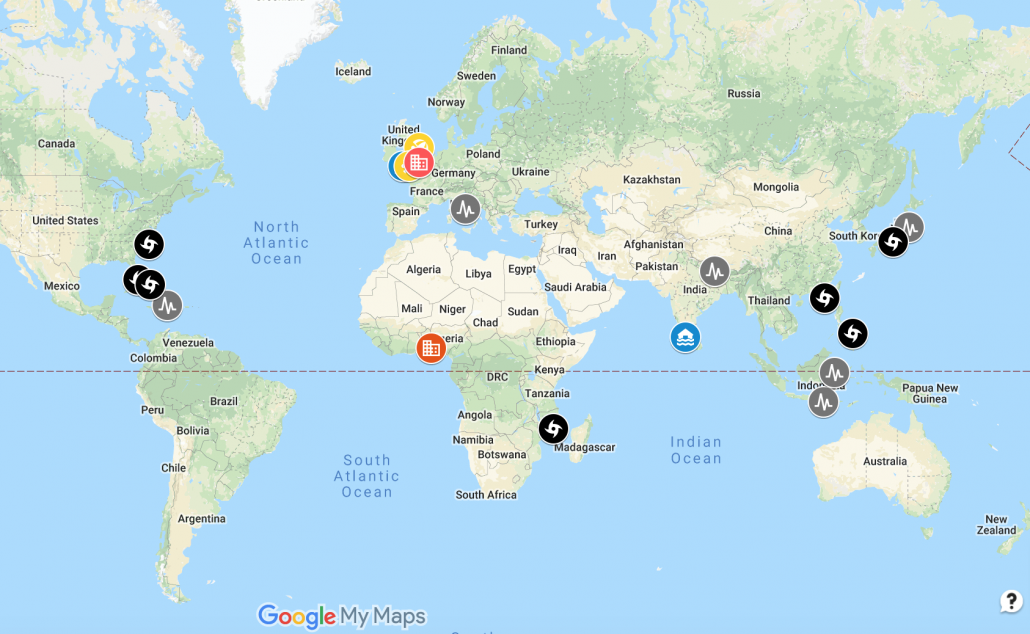
Google My Maps is a great way of collating and displaying case studies in one place. They are a great tool to use for revising case studies. Students can collaborate on revision maps and add text, images and videos to pins for each case study. We’ve put together a tutorial that students can use to create a case study map.
2. Presenting coastal fieldwork data
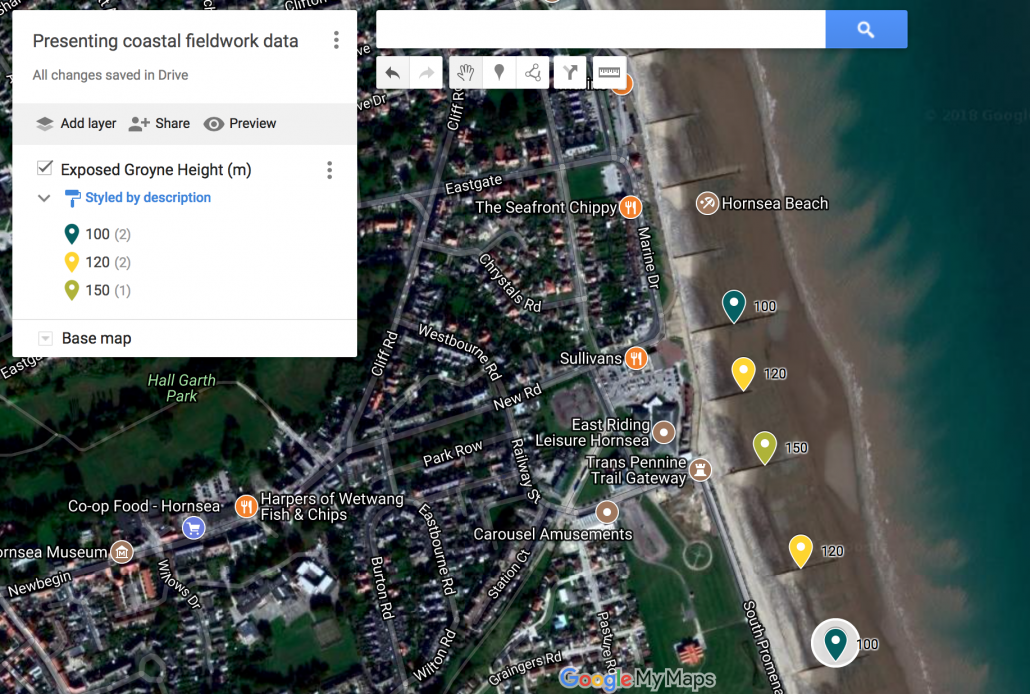
Completed map
Presenting data collected during a coastal fieldwork study is really simple on Google My Maps. For example, data collected as part of an investigation into the impact of groynes on longshore drift, can be easily presented on a satellite image. The up-drift and down-drift height of a beach can be plotted on pins to illustrate changes along the beach. Students will be able to see geospatial patterns in the data which they can then analyse. Take a look at our guide to presenting coastal fieldwork data.
3. Presenting river fieldwork data
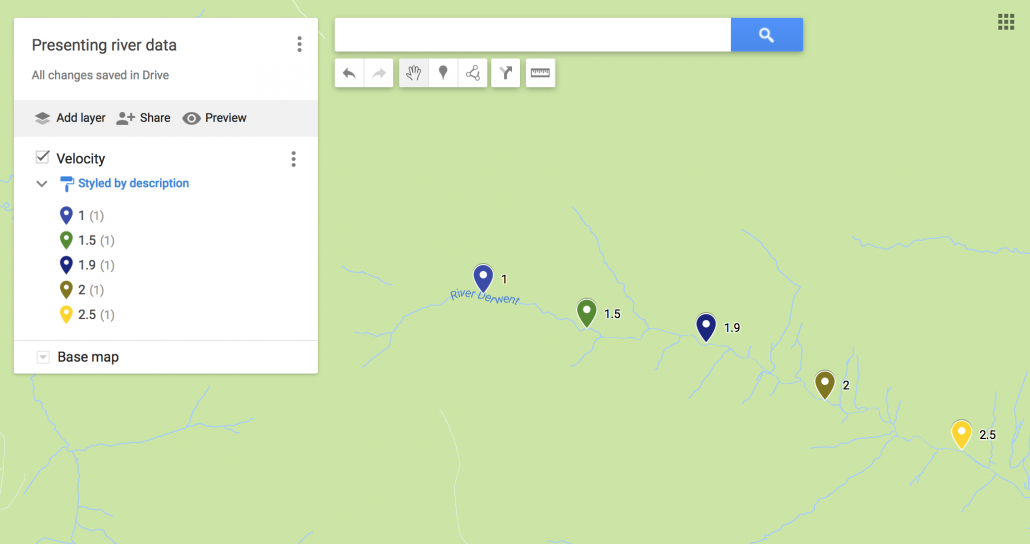
map with data on
As with coastal fieldwork data, it is really easy to present river fieldwork data on Google My Maps. Data such as wetted perimeter, discharge and velocity can be displayed at appropriate locations along the course of a river. Check out our guide to presenting river fieldwork data.
4. Landuse maps
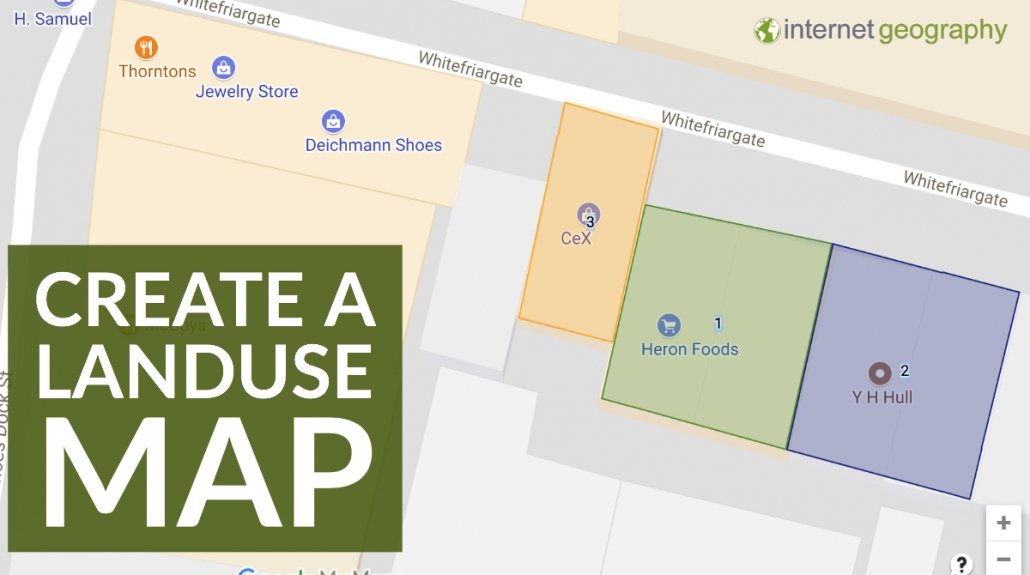
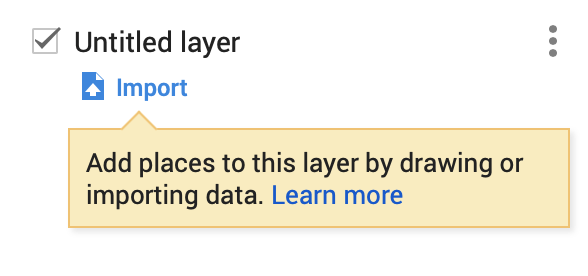
Landuse maps are easy to create in Google Maps. Using the polygon tool shapes can be drawn on a layer over satellite images of your study areas. Find out how to create a landuse map in Google My Maps.
5. Measuring Distance
Google My Map has a powerful measurement tool that can be used to investigate distance on maps. It can be used in a range of ways including:
- identifying locations that are equal distances apart for fieldwork e.g. river sampling locations
- measuring the impact of coastal erosion
- calculating the length of lava flows
- calculating distance between places, both straight line and following a route
Take a look at our guide to using the measuring tool in Google My Maps.
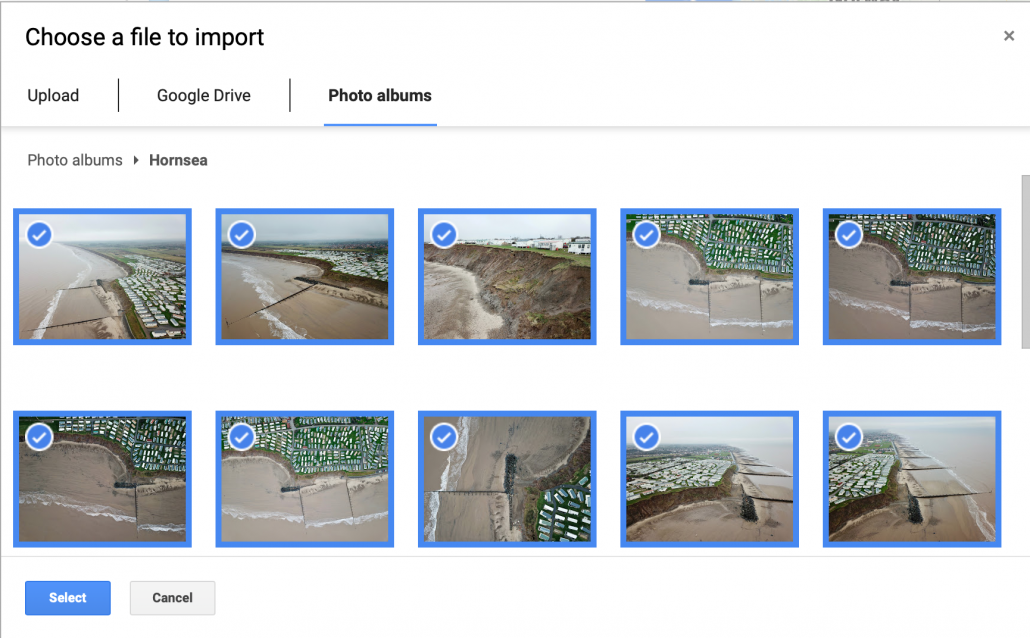
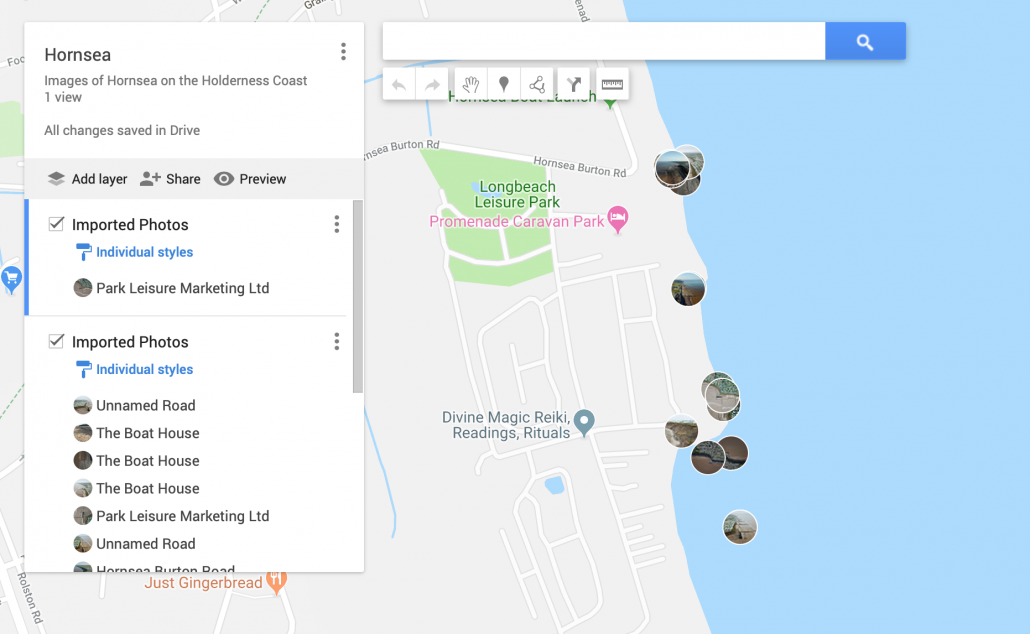
6. Map your photographs
Using Google Images and Google Maps you can easily create a map using an album of geotagged photos. Geotagged photos are those that include data on the location they were taken. Most modern mobile phones have this feature as do some digital cameras. If you are not sure a quick search on the Internet will tell you if this option is available and how to enable it. Take a look at our guide to mapping photographs using Google My Maps.
7. Go on a scavenger hunt
It’s possible to search for locations using longitude and latitude. Why not give students a list of points via latitude and longitude and have them use Google My Maps to find out what each point is. You could also provide 3 locations and ask the students to work out what they have in common. They could examine each location using the satellite image layer to work out the physical and human characteristics the places have in common. Turn it into a game: the first student to figure them all out wins. Do this in small groups or as an independent activity, in class or for homework.
8. Plan a route
Students could use Google My Maps to plan a route. The purpose of the route could be to create an interactive tour to show the human and physical characteristics of an area.