Increasingly students are being expected to ‘think like a geographer’ by applying skills, knowledge and understanding to unfamiliar contexts.
The use of photographs and question stems is a useful way of encouraging students to ‘think like a geographer’. After all, students have to learn how to ask questions to be able to apply themselves to unfamiliar contexts.
Before this can be done, students need to have a basic understanding of what geography is, and this post is based on the premise that they have an awareness of the main geographical concepts your curriculum is based on.
The first step in achieving this might be to introduce the concept of using images to think like a geographer. Modelling how a geographer might use a photograph to consider the geography of a particular location to demonstrate the process through thinking aloud would provide cognitive strategies that students could adopt. Thinking aloud by the teacher will provide students with a way to witness expert thinking, usually hidden from them.
The next step in encouraging students to think like a geographer could be to provide scaffolding and model geographical questions using images.
General question stems, applicable to most geographical photographs, could be introduced to less experienced students of geography. Examples could include:
What are the main geographic features shown in the picture?
What are the human features of _____________?
What are the physical features of ___________?
How are the physical and human features of __________ linked?
What are the strengths and weaknesses of _______________?
How does ________________ affect ________________?
How does ________________ link to ________________?
How does the location compare to __________________?
What processes cause ________________________?
How would changing ____________________ affect ____________________?
How is this _________ interdepedent?
What issues relating to sustainability affect ____________?
How does __________________ link to what you have studied in geography in the past?
What do you not understand about _______________________?
In what way is _____________ related to _______________?
Alternatively, you could use more concrete prompts to encourage students to think like a geographer. Examples include:
Identify the geographical concepts evident in this image
Write a sentence/paragraph to reflect what is shown in this image
Use these words as a prompt to figure out the main geographical issues evident in this image.
Select two details that elaborate on the main geographical issues in this area and are important to remember
How might changes in this area have a positive/negative impact?
Describe and explain the issues of sustainability in this image.
Explain the potential impact of climate change on this area.
What are the human and physical processes in this area and how do they interact?
As students become more experienced asking geographical questions, the teacher could then move onto providing students with prompts such as who, what, when where, why and how before removing the scaffolding completely. Of course, this can be done at any time that is appropriate for individual students.
As students are analysing the photograph it is a good opportunity for the teacher to circulate and check and challenge student thinking. Providing hints, prompts, suggestions, and feedback when students encounter difficulties is encouraged at this stage.
Following this, targetted questioning is a useful way to check understanding and address misconceptions that students might have.
https://www.internetgeography.net/wp-content/uploads/2019/08/Thinking-like-a-geographer-scaled.jpg10661600Anthony Bennetthttps://www.internetgeography.net/wp-content/uploads/2024/01/Internet-Geography-Logo.pngAnthony Bennett2019-08-02 11:40:362026-06-16 15:31:57Using Images in Geography #3 Thinking like a geographer
From heatwaves to flash floods, the UK has experienced several extreme weather events this year. Extreme weather is when a weather event is significantly different from the average or usual weather pattern and may occur over one day or a period of time. Flash flooding, drought, storms, cold spells and heatwaves are all examples of extreme weather in the UK.
The UK experienced two extreme weather events within a fortnight in July 2019. Below we explore their causes, impacts and the relationship between extreme weather events and climate change.
July 2019 Heatwave
In July, the UK experienced its hottest day on record when temperatures reached a record-breaking 38.7°C at Cambridge University Botanic Gardens. An extreme pattern in the jet stream caused the heatwave. The jet stream separates hot air in the south and cold air in the north. An extreme kink in the jet stream, caused by an omega block (a high-pressure pattern that blocks and diverts the jet stream) allowed a mass of hot air to flow up from northern Africa and the Iberian peninsula – following a similar extreme weather event last month that made it the hottest June on record.
The heatwave had a significant impact on the UK transport infrastructure.
Rail transport experienced disruptions due to the risk of railway lines buckling, damaged overhead electric wires and high temperatures on trains. The train company LNER allowed customers with tickets for the 25th July to travel on Friday 26 July, Saturday 27 July and Sunday 28 July.
High temperatures, up to 39.4°C, were recorded on the tube in London.
Manchester Metrolink put in place temporary speed restrictions across its network as speed limits on most commuters lines were cut from 60mph to 30mph.
Lidos in Peterborough, London’s Tooting Bec and at Hemsley in York had to turn away prospective swimmers after reaching capacity.
In Bristol, a major water main burst due to hot temperatures making the ground shift leading to pipes contracting and expanding, left thousands of people without water. Vulnerable people had bottled water delivered to them, and tankers provided water in the area.
.@BristolWater says it is working to restore water to Speedwell, Eastville, Fishponds and parts of Horfield as a result of this burst water main. pic.twitter.com/mSwn60Zxhx
According to the comparison website, Price Spy, some retailers increased the price of fans and portable air conditioners by up to 40% within a month.
Animals also suffered during the heatwave. SEA LIFE Blackpool cooled the seawater for the first time in 30 years
The heat led to the cancellation of five of the six greyhound races due to take place on Thursday 25th July.
Police in Devon issued a warning to the public not to leave pets inside cars after officers rescued a dog locked inside a vehicle for more than three hours.
The hot daytime temperatures led to evening thunderstorms across the country.
It was not just the UK that experienced high temperatures. Many countries across Europe also experienced record-breaking temperatures including Germany, The Netherlands and France.
In the Netherlands, the national institute for public health and the environment issued a “smog alarm” due to severe air pollution in parts of the country due to ozone in the air.
July/August 2019 Flash-flooding
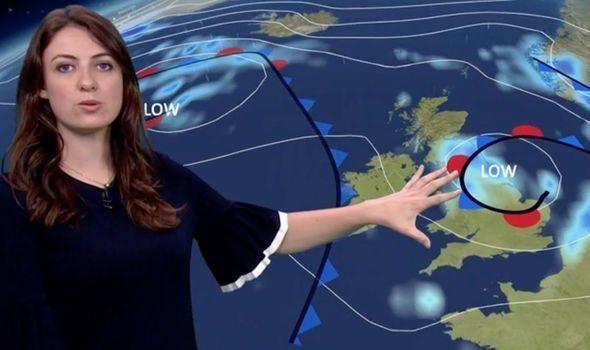
July also saw intense rainfall across parts of the country including central areas, the north-east and north-west of England. Several low-pressure systems affecting the UK caused the rainfall.
Low-pressure systems affecting the UK 29-07-19 – Source BBC
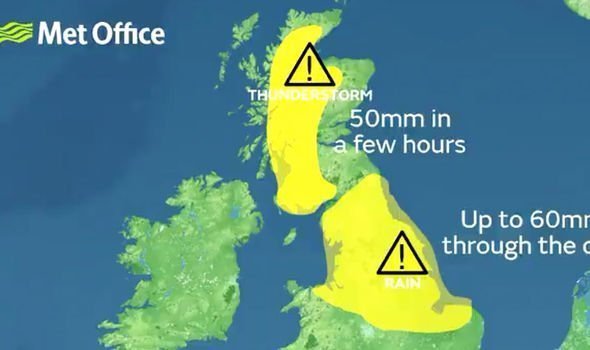
Met Office issues two weather warnings for Wednesday (Image: MET OFFICE)
The conditions were a long way from the previous week’s record highs as blistering sun basked Britain.
The Environmental Agency issued multiple flood warnings and alerts covering central, north-west and north-east England following heavy rainfall from the 28th July 2019.
An Environment Agency incident room for the north-west was set up in Warrington on 28th July.
Heavy rainfall caused widespread flooding in North Yorkshire on the 29th of July. The fire service received 115 calls concerning flooding incidents in Leyburn and Reeth on Tuesday evening. Photographs and videos from the nearby village of Grinton showed a bridge, used in the 2014 Tour de France, in ruins.
Due to more heavy rain overnight, there is travel disruption in parts of the country, including Yorkshire where roads and rail are affected & the bridge on Grinton Moor has collapsed.
Commuters faced chaos Wednesday morning as heavy rain flooded the railway between Manchester Piccadilly and Crewe/Stoke-on-Trent, causing both lines to be blocked.
Northern Rail suspended trains between Ribblehead and Kirkby Stephen after a landslip between Dent and Ribblehead.
A major incident was declared late on Wednesday 31st July in Poynton, Cheshire, where thunderstorms and flooding forced drivers to abandon their vehicles and caused damage to property.
The wet weather also disrupted the railway line between Manchester airport and Wilmslow early on Thursday 1st August.
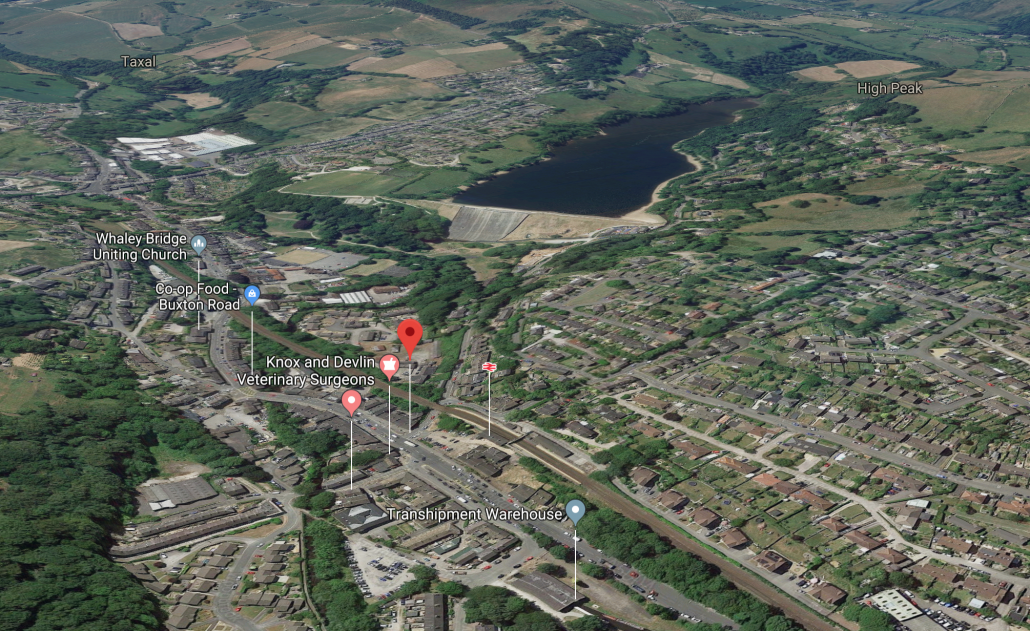
In the afternoon of Thursday 1st August the 1500 of the 6500 residents of Whaley Bridge, Derbyshire were evacuated due to the increased risk of the dam wall at Toddbrook reservoir collapsing.
Whaley Bridge
Residents of Whaley Bridge in Derbyshire were asked to leave their homes due to a severe flood warning indicating danger to life. Police told residents to gather at a local school, taking pets and medication with them.
Evacuated residents were told to arrange accommodation due to limited space, but some local pubs and community halls offered to take in evacuees.
Pictures on social media showed panels on one side of the dam had collapsed.
Significant overflow from the reservoir, caused by heavy rain, undermined the reservoir presenting a risk of collapse. The Canal and River Trust drained the water from the reservoir in a bid to reduce the pressure on the dam wall. The fire brigade also used ten high-volume pumps, with the capacity to move 7000 litres of water per minute, to remove water from the reservoir.
Offers of shelter for people displaced by the flooding in Whaley Bridge were made on social media.
If anyone in #WhaleyBridge needs a place to stay tonight, please get in touch. We’ve gotta look after each other at times of need ❤️ I make a banging brew as well.
The local secondary school was used as a command centre for emergency services.
An RAF Chinook helicopter has been used to drop ballast to divertwater courses flowing into the reservoir and shore up the dam itself.
A team from our Joint Helicopter Support Squadron has been in #WhaleyBridge since the early hours of this morning helping the @RoyalAirForce Chinook Force deliver 400 tonnes of aggregate to aid efforts to protect the dam from breaching. pic.twitter.com/IOqdcoNh0I
Elsewhere in Derbyshire, the A6 between Buxton and Bakewell was closed, and ten cars in the Scropton were recovered from floodwaters.
In Leicestershire, an international Scout and Guide camping event at a farm near Ibstock ended early due to the “unprecedented” wet conditions.
Is our extreme weather linked to climate change?
Extreme weather events are becoming more common, starting earlier and becoming more intense.
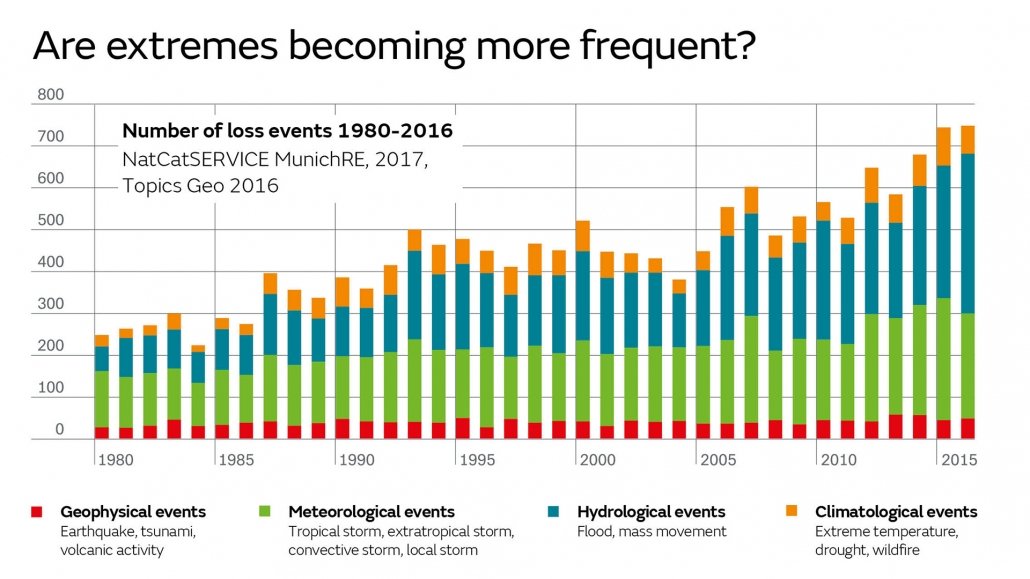
The graph below shows an increasing trend in meteorological (storm), hydrological (flood) and climatalogical events (extreme temperature).
Are extreme events becoming more regular? source – Met Office
The Intergovernmental Panel on Climate Change Fifth Assessment Report (2014) showed that changes in many extreme weather and climate events have occured since about 1950.
There is evidence that humans have contributed to changes in temperature extremes, heavy rainfall events, and an increase in extreme high sea levels in a number of regions.
Extreme weather does not prove the existence of a warming earth, but climate change is likely to exaggerate it. According to the Intergovernmental Panal on Climate Change (IPCC) “a changing climate leads to changes in the frequency, intensity, spatial extent, duration and timing of extreme weather and climate events, and can result in unprecedented extreme weather and climate events,”.
Based on more than 150 studies into the link between human action and weather events around the world the following conclusions have been drawn:
Extreme heat: Almost all studies on extreme heat events indicate human influence.
Drought: About half the studies on drought show significant human influence.
Extreme rainfall: A smaller but increasing number of studies on extreme rainfall detect a human signal.
Tropical storms and hurricanes: The picture here is complex. There is strong evidence that increasing sea temperatures increase the intensity of tropical storms. Rising sea levels also increase the risk of coastal flooding. However, there may be an overall decrease in the global total number of tropical cyclones.
A study published early in 2019 by the Swiss Federal Institute of Technology in Zürich said the summer heatwave that occurred across northern Europe last year would have been “statistically impossible” without climate change driven by human activity.
https://www.internetgeography.net/wp-content/uploads/2019/08/uk-weather-forecast-met-office-warning-bbc-weather-29-07-19.jpg350590Anthony Bennetthttps://www.internetgeography.net/wp-content/uploads/2024/01/Internet-Geography-Logo.pngAnthony Bennett2019-08-02 09:56:002019-08-02 10:01:33Extreme weather in the UK – 2019
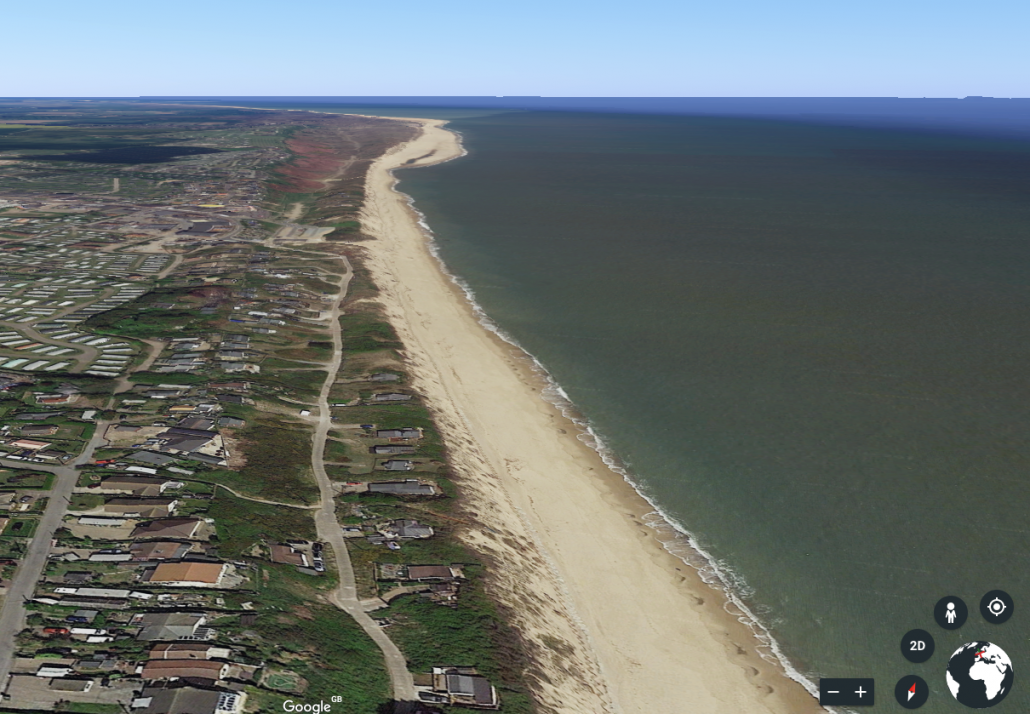
On December 5th 2013 the east coast of England was affected by flooding not seen on a scale since 1953. The combination of a high spring tide, an area of low pressure and high northerly winds was responsible for the floods. On the Holderness Coast, a large section of Spurn Point was eroded, leading to the destruction of dunes and collapse of the road linking the spit to the mainland.
In Lincolnshire 1,400 homes were flooded, including 300 in Boston, Lincolnshire, according to Environment Agency (EA) figures.
Further south at Hemsby, on the Norfolk coast, seven properties fell into the sea. Since the storm surge in 2013 and subsequent ones in 2017 and 2018, a considerable number of bungalows were perilously close to the sea. Seven homes on The Marrams in Hemsbey were demolished in March 2018 when they were left uninhabitable due to the collapse of the sandy cliffs.
The Google Earth image below, taken on 5th November 2017, shows The Marrams. The image shows some of the remaining properties in 2017.
Hemsby on 5-11-2017
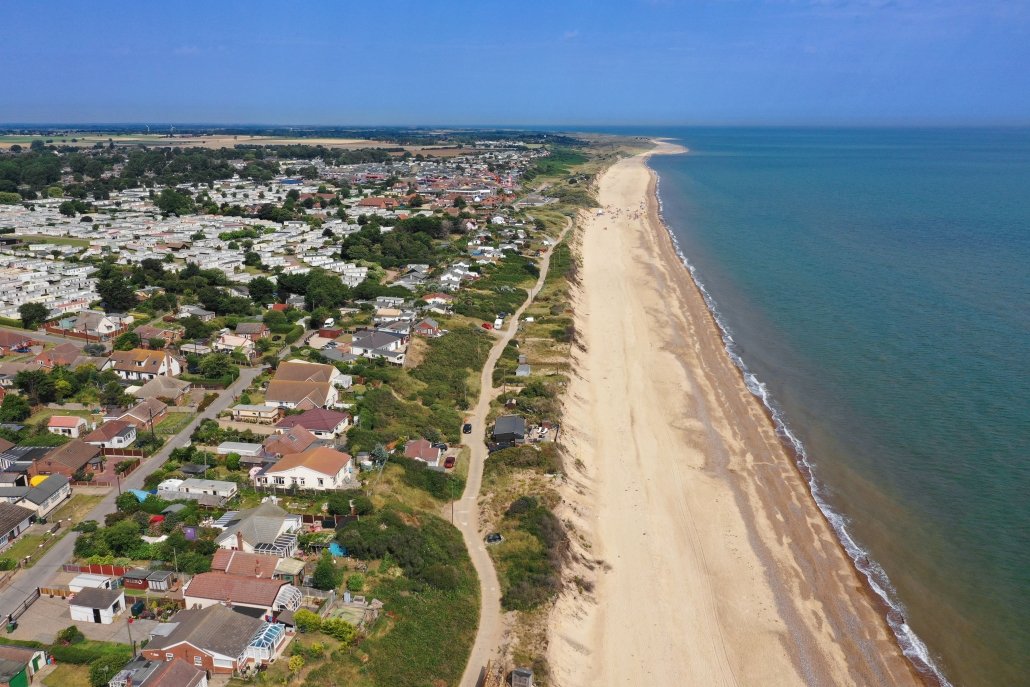
However, the recent aerial photograph taken on 25th July 2019 shows just one property remaining.
Hemsby on 25-07-2019
An environmental impact assessment, completed early in 2019, will pave the way for planning permission for a “rock berm” to be put in place.
According to the BBC “Once planning permission is granted, the process will begin to raise the money needed to install the rock berm, likely to cost between £3m and £9m.”
Funding for the project will be a combination of local business contributions and central government.