Is it time to change how we measure development?

On May 11th author, environmentalist and investigative journalist George Monbiot tweeted an article on The Guardian that really caught my eye.

His post shared a piece on The Guardian website by Fiona Harvey exploring the findings of a YouGov poll which suggests Britons want the quality of life indicators to take priority over the economy. The results of the survey suggest eight out of 10 people would prefer the government to prioritise health and wellbeing over economic growth during the coronavirus crisis, and six in 10 would still want the government to pursue health and wellbeing ahead of growth after the pandemic has subsided. 

The campaign group that commissioned the research, Positive Money, has suggested the government should publish statistics on social indicators, health, the environment and quality of life give a truer reflection of the UK’s status and should be used by policymakers to meet the needs of the population. 

The group have produced a report entitled The Tragedy of Growth, backed by politicians from several parties, including Clive Lewis of Labour, the Green party MP Caroline Lucas, and the former Conservative environment minister Lord Deben, who chairs the committee on climate change. The report calls for a shift away from GDP as the government’s core measure of success. The reasoning behind this is that economic growth, through measures such as GDP, masks the impact economic development has on people’s health and well being, the gap between rich and poor and its environmental impact. 

Having read the initial article and report I returned to the original tweet and trawled through the replies to the original post.  I found myself descending a late-night rabbit hole that led me on a journey exploring changes to how development is being measured in countries such as Iceland, Bhutan and New Zealand. 

This included watching a thought-provoking video called the Gross National Happiness The Paradigm (see below) produced by the Schumacher College and the Gross National Happiness Centre in Bhutan. In it Tho Ha Vinh, program director at the GNH Centre, Butan explains how this paradigm shift involves redefining what we mean by development, making a comparison with the natural world, through the growth of a seed, leading to the development of its own nature. He goes on to discuss how foreign ideologies have been forced on countries, and economic development has been prevalent in measuring the ‘success’ of countries to the expense of other indicators. He raises an interesting point that the economy is a mean, not an end. The end is satisfying human needs.  He argues that the goal of an economy should be to bring humans happiness and well-being. Additionally, he raises the point that it is not enough for an economy to focus purely on human needs and that the needs of the natural environment should also be met. He finishes by discussing the need for each country to have its own organic development, based on traditions and culture, that it should meet the needs of the whole (humans and environment).  

The TED talk,  Bhutan’s Gross Domestic Happiness and Environmental Initiatives, by Tshering Tobgay, Prime Minister of Bhutan explores the paradigm shift in more detail and is certainly worth a watch. 

I then went on to discover New Zealand’s new well-being budget that seeks to expand mental health services, reduce child poverty and homelessness, promote Indigenous rights, fight climate change, and expand opportunities and watched Iceland PM Katrin Jakobsdóttir talk about GDP or well-being.


Is it time to change how we measure development?
I may be late to the party on all this, but having reflected over the last 24 hours I’ve come to the conclusion that there is a fantastic opportunity to explore the issues raised in these sources with students, particularly given the results of the YouGov poll which are likely influenced by the Covid-19 outbreak. We have been presented with an opportunity to reflect on what is really important to both the human and natural world. As geographers, we are in the perfect position to investigate this question, given the multitude of synoptic links the question draws on from our discipline. The underlying themes of sustainability, conservation, interdependence, international development, the use of natural resources, spatial variation and change over time could provide a wonderful opportunity to pull together the geography curriculum. The question has the potential to be an amazing enquiry to investigate with learners. If you fancy joining me down the rabbit hole, throwing some ideas about for a unit of study, please let me know


Thanks, 

Anthony 


Investigating links in geography using KnowledgeBase Builder

Geographers see connections in the world, how things interact and inter-relate. Making links in geography involves examining relationships within and across themes. An understanding of these links supports students in seeing how the world is interconnected.

One strategy to encourage students to investigate links could involve the use of concept maps. However, before your students attempt their own concept maps it would be useful to live model links with them. Enter KnowledgeBase Builder.


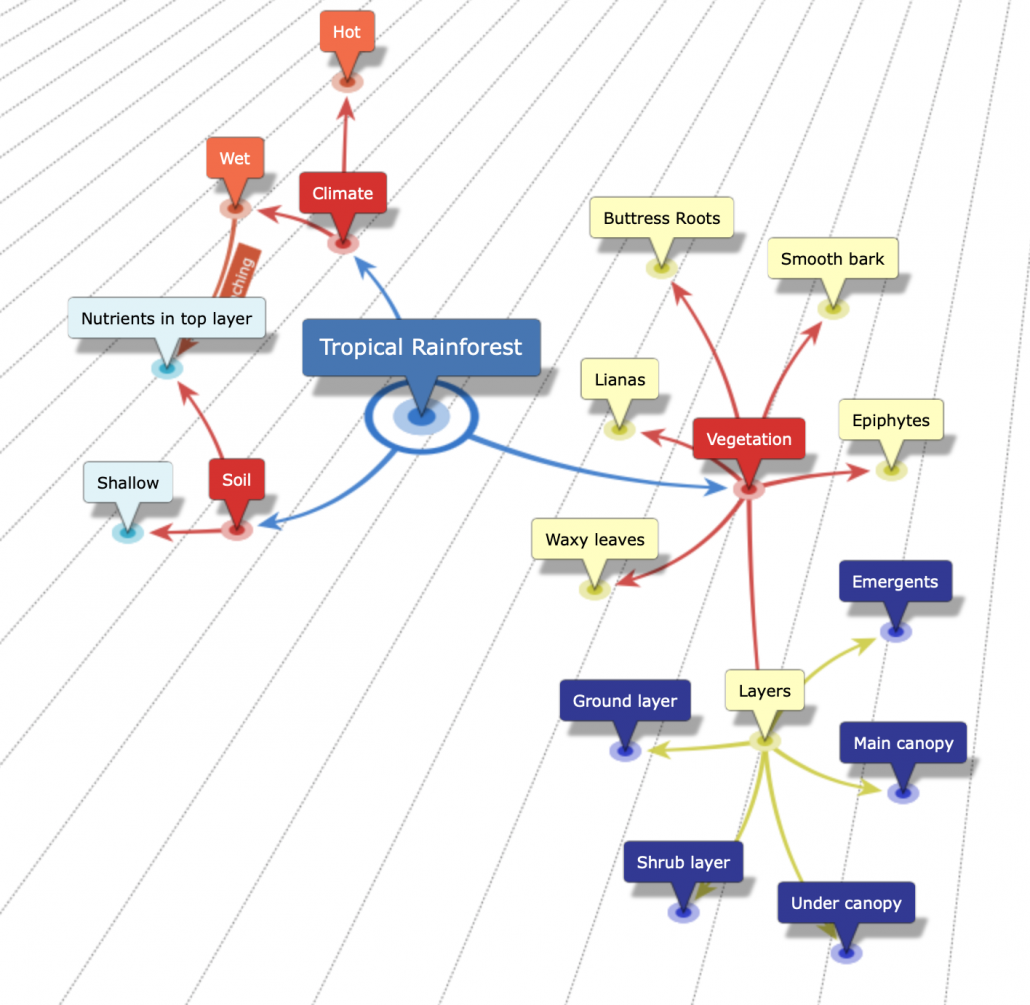
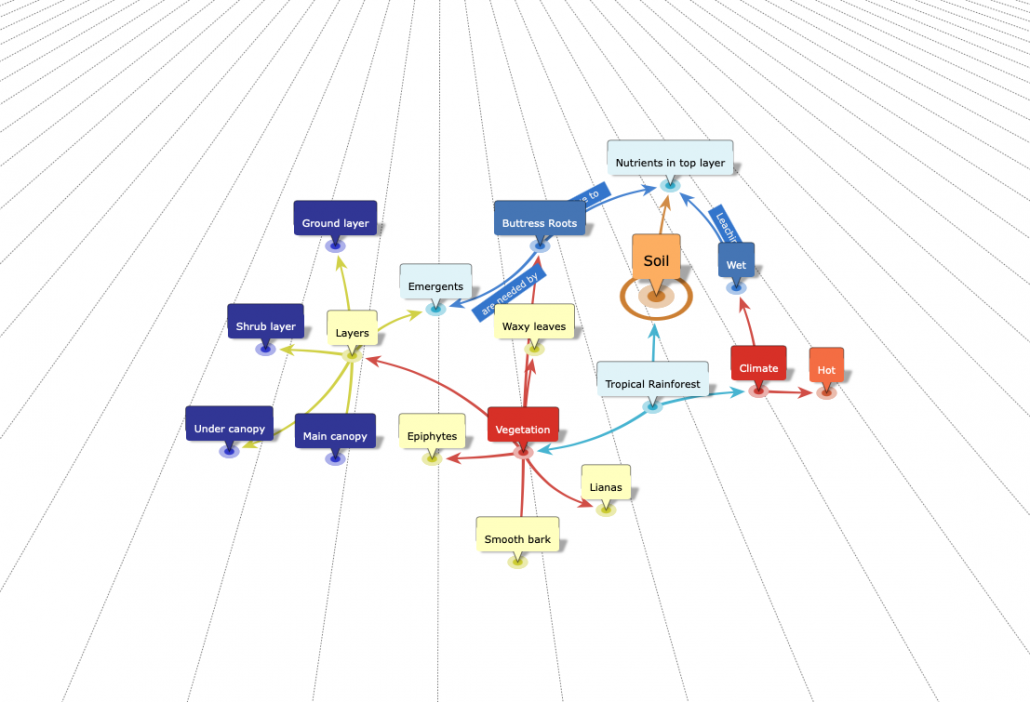
Available for Windows, Android, IOS and Mac OS, KnowledgeBase Builder is a remarkably easy tool to map out curriculum content then investigate links. In the example below, we have produced a simple map the characteristics of the tropical rainforest (for demonstration purposes, there’s lots more that could be added). The characteristics are grouped under headings including vegetation and climate etc. This could be achieved by students contributing key features based on prior learning.

Characteristics of tropical rainforests

Characteristics of tropical rainforests

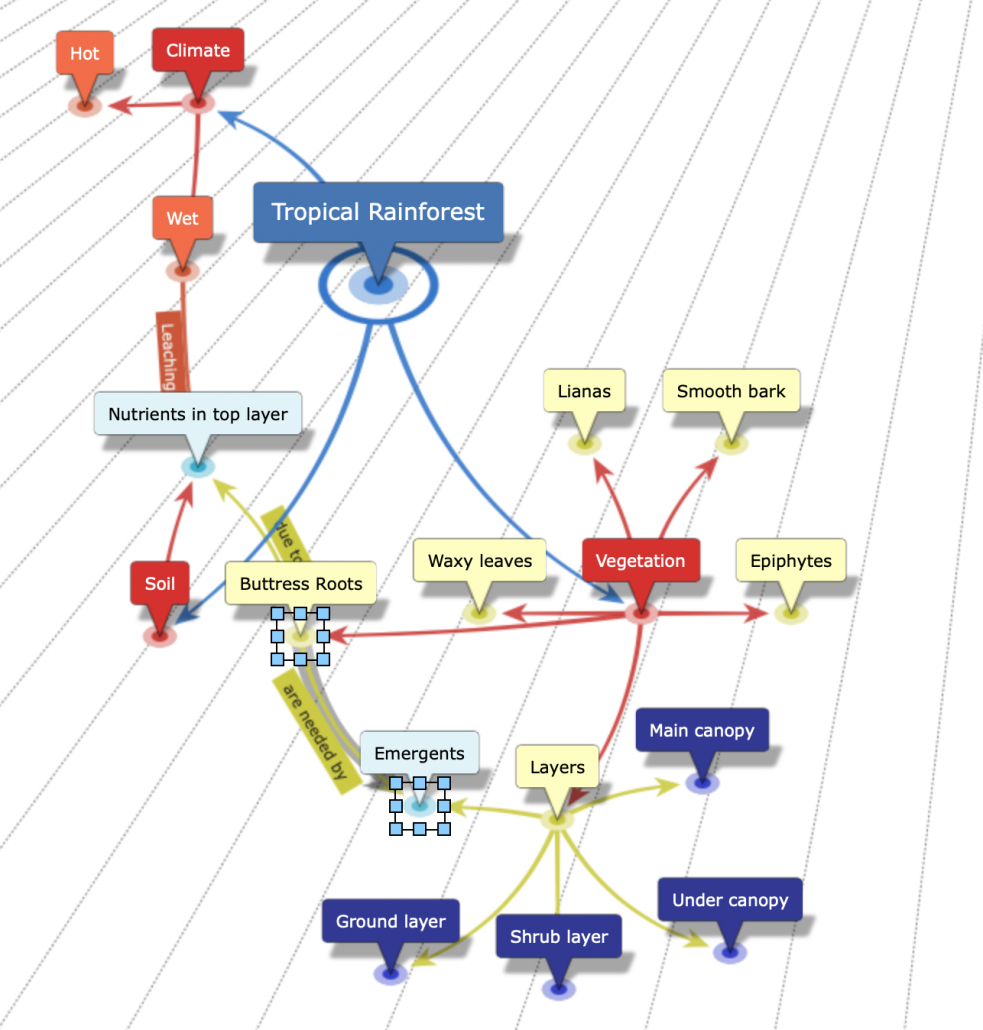
Next, it’s time to investigate links between the different characteristics. Simply drag a connection between two elements, give it a simple title and an explanation of how the two are connected. Below is an example of a link between buttress roots and emergents.

Making a link

Making a link

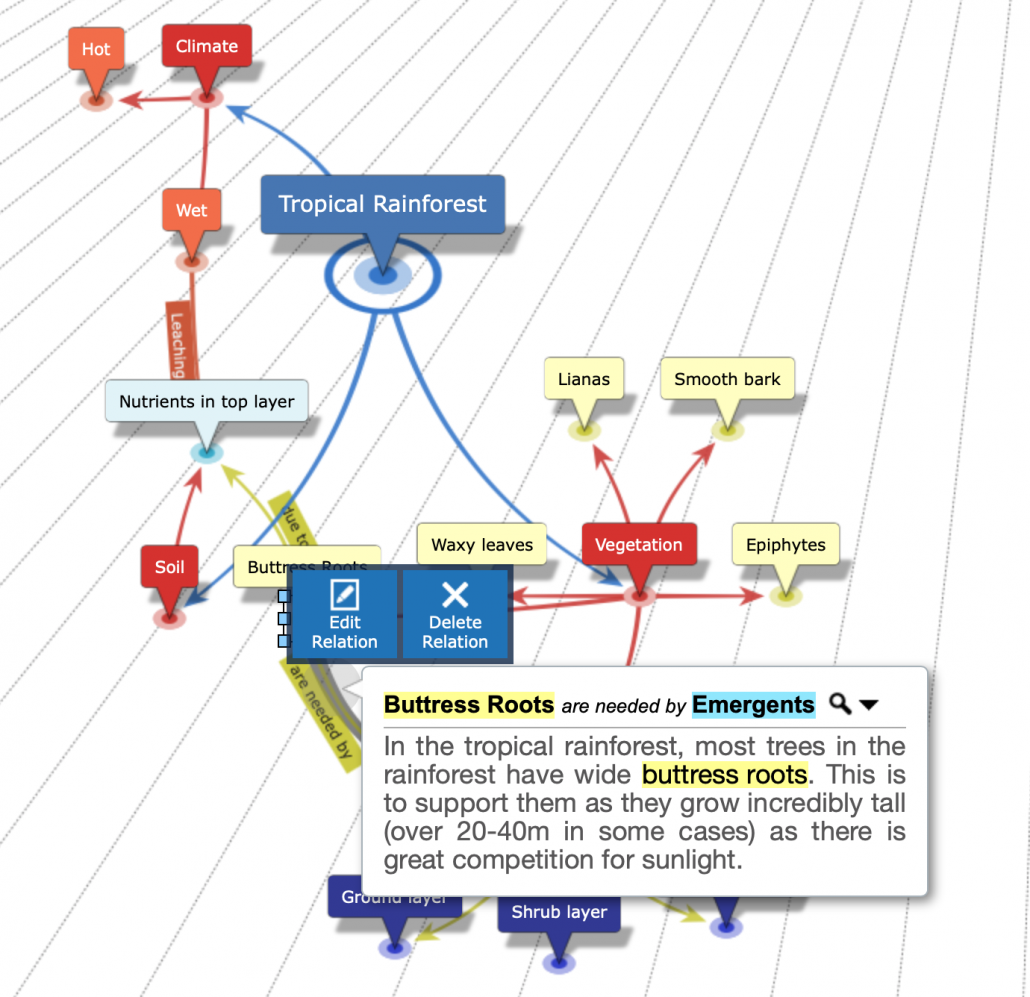
Once an explanation has been added in the description box, simply click the link to display the explanation as shown below.

View the link

View the link

You can view your map in a range of ways including as a table which shows the main characteristics as shown below.

Information presented as a table

Information presented as a table

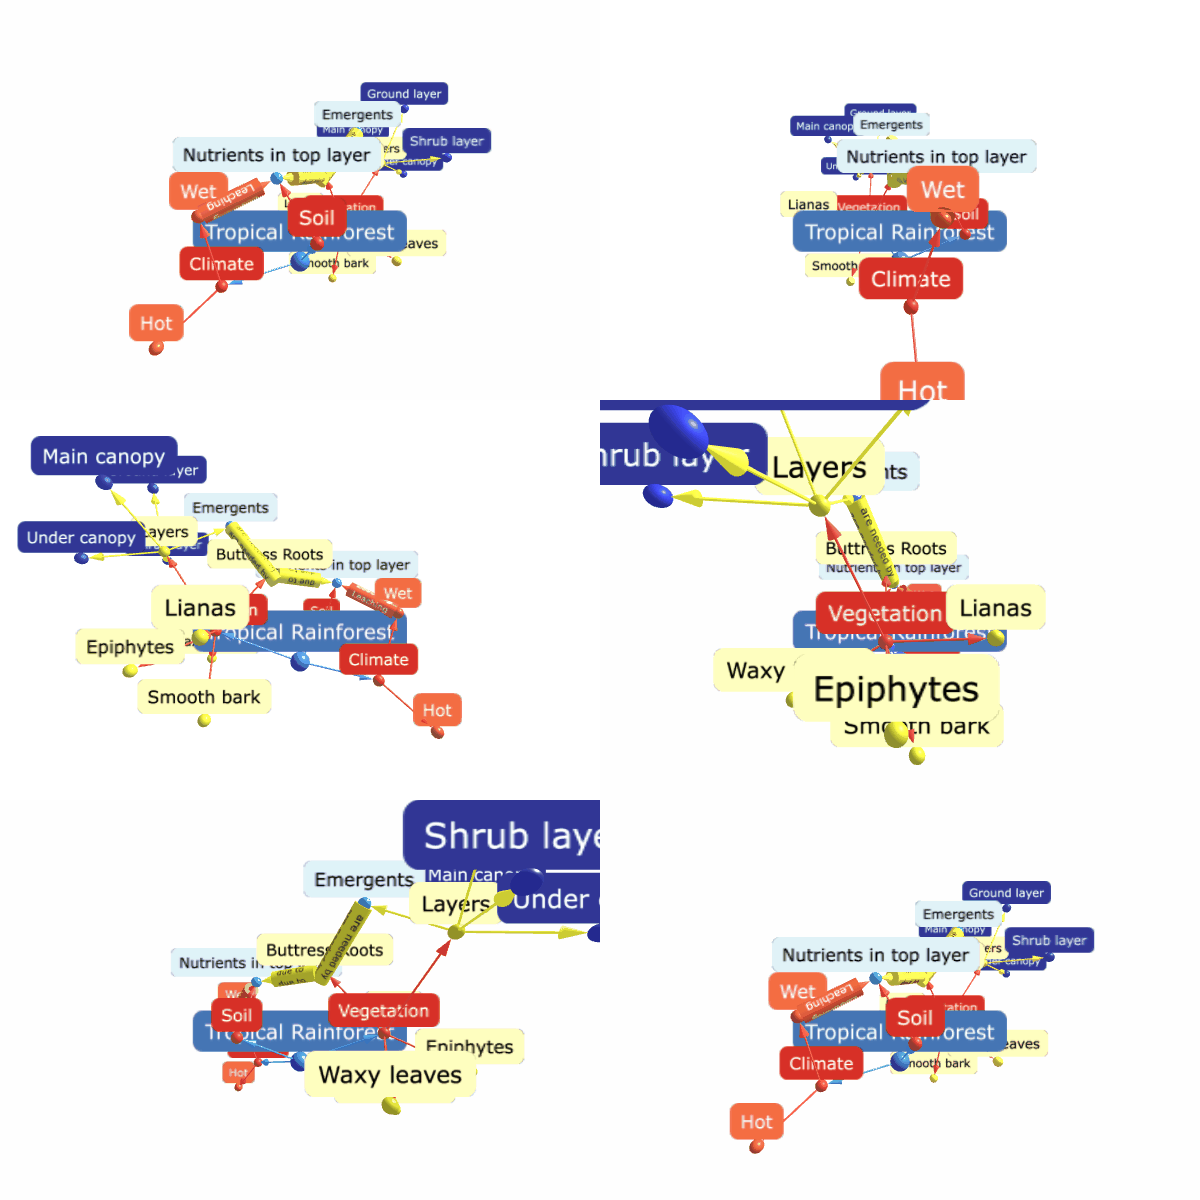
You can also view the map in 3D. Which looks pretty fancy! It is possible to save the 3D graphic as an animated gif.


There are several options for exporting your finished diagram. Below is an example of an exported image.

The information can also be exported as an HTML file (web page).

Other features included in the software to explore include:

  • adding images
  • reverse links where flows/links go in both directions
  • adding hyperlinks
  • embedding Wikipedia pages

In this example we have explored links within a theme, however, we can just as easily develop a map over time and explore synoptic links in geography.

Acronyms in geography to improve writing

Acronyms are a great way of supporting students when writing like a geographer. They provide a simple framework for students to follow when answering different types of geographical questions. If embedded throughout key stage 3 and 4 they are powerful tools for learners to draw on in the tension-thick exam hall.

Having reached out to Twitter for acronym suggestions, we’ve pulled together a range of strategies that may be useful to you and your students. Many thanks to everyone who contributed!

We do not recommend teaching students all of the techniques below. It is more useful to cherry-pick a small number to try. Also, while acronyms provide support and structure to students there is a risk that answers can become too formulaic. Students need to be taught how to use these acronyms effectively – knowing when and how to confidently apply or deviate from them.

If we’ve missed out a useful acronym please leave a comment at the bottom of the page. If you have any resources you’re prepared to share based on these strategies please send a copy to [email protected].

Acronyms for thinking synoptically

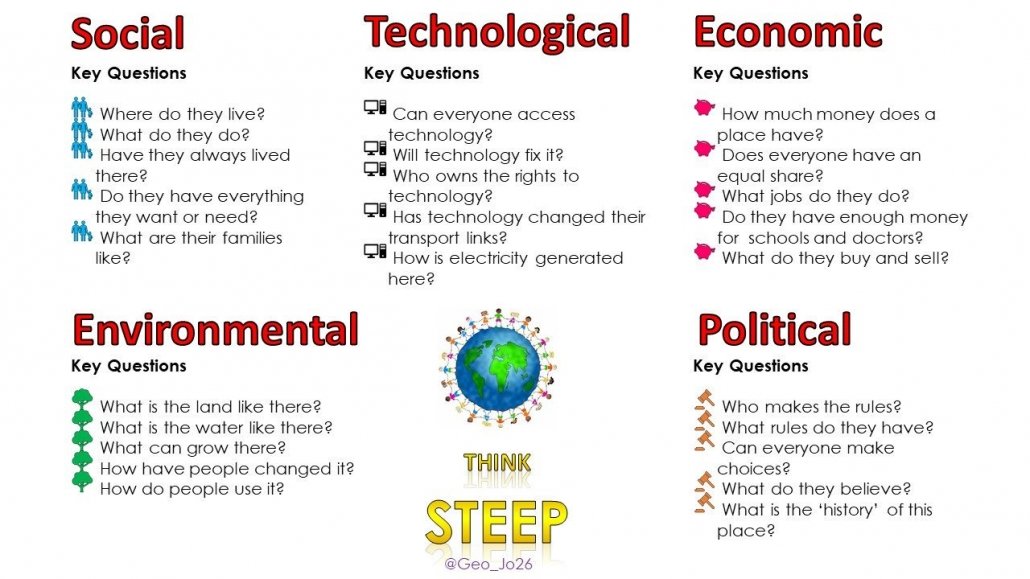
STEEP – Social, Technological, Economic, Environmental & Political (includes Historical)
Why use it?
A useful way of encouraging students to make connections.

The image below, provided by @geojosie, provides a structure for using STEEP.

STEEP - encouraging learners to think synoptically

STEEP – encouraging learners to think synoptically

Acronyms for answering geographical questions

SEE – State, explain, example
Why use it?
Provides a simple structure when answering questions. Students will give an answer (state), explain it and back it up with an example.

PEE – Point, explain, example
Why use it?
Provides a simple structure when answering questions. Students will give a point, explain it and back it up with an example.

The video below, by Kit Rackley of GeogRamblings, explains the technique in a geographical context.

PEEEL – Point, explain example, evaluation and link
Why use it?
Further development on the PEE acronym.

PEDaL – Point, evidence/explain, develop, link
Why use it?
Useful for explaining answers and making links back to the question.

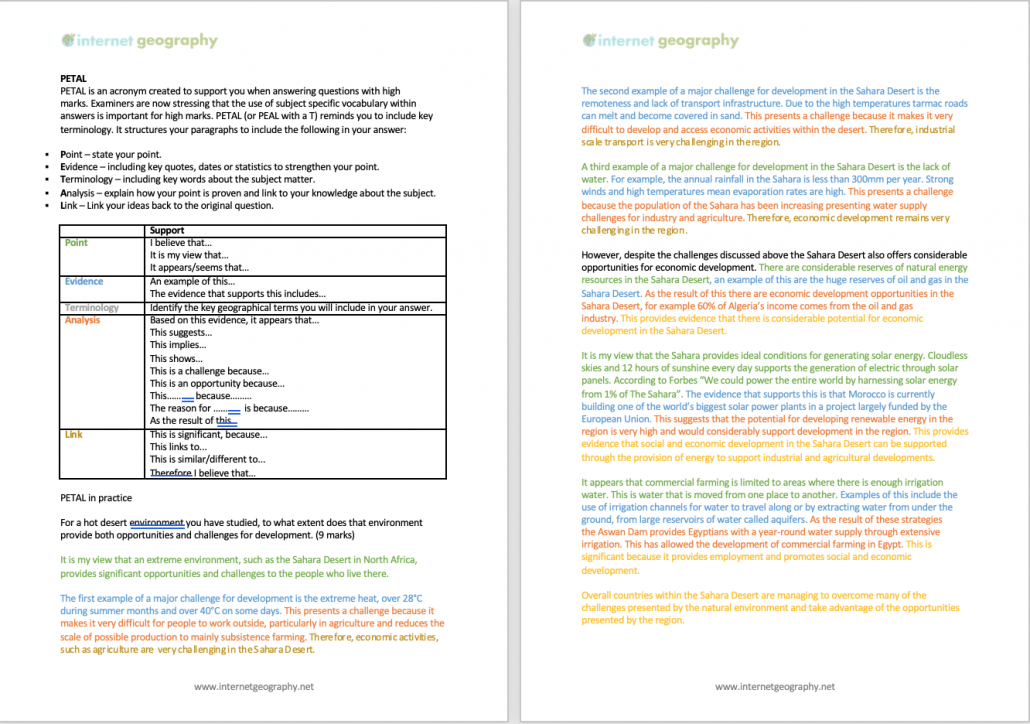
PETAL – Point, evidence, this means that, as a result, link.
Why use it?
A development of PEDaL that provides further structure to explanations and considers impacts.

PELE – Point, explain, link, evidence
Why use it?
Legendary footballer!

SHEEP 🐑 Social, historical, economic, environmental, political
Why use it?
Supports development of answers, particularly for high tariff questions.

Acronyms for geographical distribution/patterns/locations

CLOCCK – Continent, latitude/longitude, ocean/sea, country, compass, kilometre
Why use it?
A technique for describing geographical locations on a map.

GSE Generally, specifically and exception
Why use it? 
Useful for distribution/location questions

Acronyms for graphs/data

TEA – Trend, example, anomaly
Why use it?
Useful for analysing graphs.

TREE – Trend, rate of change, examples/evidence, exceptions
Why use it?
Useful for analysing graphs, this structure ensures students cover all possibilities when analysing data.

TEAL – Trend, example, anomaly, links
Why use it?
Useful for analysing graphs.

PALMS – Pattern, anomaly, least, most, stats
Why use it?
Useful for analysing graphs and maps.

PADL – Patterns, anomalies, data, links to topic(s).
Why use it?
Ideal for resource-based questions.

PDA – Patterns, data, anomalies
Why use it?
Ideal for ensuring students include data in descriptions.

FART – Figures, anomalies, rate and trend.
Why use it?
The students will remember it! Useful to remind them of rates and trends in data.

GEE it’s a graph! Generally, examples include, exceptions include…
Why use it?
Particularly useful for sentence starters.

TRASH – Trend, range, anomalies, smallest, highest
Why use it?
A comprehensive range of areas to cover when investigating data.

Acronyms for factors affecting climate

WORLD – Wind direction, ocean currents, relief, latitude, distance from the sea
Why use it?
Simple structure for explaining factors that affect climate.

Acronyms for exam technique – reading the question

GAMES – Geography (what knowledge will I apply?), ask (what is the question asking me to do with that knowledge?), marks (how many is it worth and how will I get top marks?), extra (do I need to use resources, maps, graphs etc.)
Why use it?
A great way to encourage students to consider what the question is asking them to do.

BUG – BOX the command word, UNDERLINE the key term/topic, GLANCE back at the question regularly.
Why use it?
Sometimes students can be guilty of regurgitating their geographical knowledge in an exam without actually answering the question. BUG the question is a great technique for students to deconstruct exam questions and increase their chances of picking up marks by writing an answer appropriate to the question.

Acronyms for decision making

MADASS – My choice, advantages, disadvantages, alternatives (compare to), sustainability, sum up.
Why use it?
A great way to encourage students to consider balance when completing decision-making activities.

If you are an Internet Geography Plus subscriber you have free access to the new resources we’re developing to support students in the use of acronyms to improve their answers to geographical questions. Click the image below to access. Get a low-cost subscription here.

PETAL Geography

Using Images in Geography #3 Thinking like a geographer

Increasingly students are being expected to ‘think like a geographer’ by applying skills, knowledge and understanding to unfamiliar contexts.

The use of photographs and question stems is a useful way of encouraging students to ‘think like a geographer’. After all, students have to learn how to ask questions to be able to apply themselves to unfamiliar contexts.

Before this can be done, students need to have a basic understanding of what geography is, and this post is based on the premise that they have an awareness of the main geographical concepts your curriculum is based on.

The first step in achieving this might be to introduce the concept of using images to think like a geographer. Modelling how a geographer might use a photograph to consider the geography of a particular location to demonstrate the process through thinking aloud would provide cognitive strategies that students could adopt. Thinking aloud by the teacher will provide students with a way to witness expert thinking, usually hidden from them.

The next step in encouraging students to think like a geographer could be to provide scaffolding and model geographical questions using images.

General question stems, applicable to most geographical photographs,  could be introduced to less experienced students of geography. Examples could include:

  • What are the main geographic features shown in the picture?
  • What are the human features of _____________?
  • What are the physical features of ___________?
  • How are the physical and human features of __________ linked?
  • What are the strengths and weaknesses of _______________?
  • How does ________________ affect ________________?
  • How does ________________ link to ________________?
  • How does the location compare to __________________?
  • What processes cause ________________________?
  • How would changing ____________________ affect ____________________?
  • How is this _________ interdepedent?
  • What issues relating to sustainability affect ____________?
  • How does __________________ link to what you have studied in geography in the past?
  • What do you not understand about _______________________?
  • In what way is _____________ related to _______________?

Alternatively, you could use more concrete prompts to encourage students to think like a geographer. Examples include:

  • Identify the geographical concepts evident in this image
  • Write a sentence/paragraph to reflect what is shown in this image
  • Use these words as a prompt to figure out the main geographical issues evident in this image.
  • Select two details that elaborate on the main geographical issues in this area and are important to remember
  • How might changes in this area have a positive/negative impact?
  • Describe and explain the issues of sustainability in this image.
  • Explain the potential impact of climate change on this area.
  • What are the human and physical processes in this area and how do they interact?

As students become more experienced asking geographical questions, the teacher could then move onto providing students with prompts such as who, what, when where, why and how before removing the scaffolding completely. Of course, this can be done at any time that is appropriate for individual students.

As students are analysing the photograph it is a good opportunity for the teacher to circulate and check and challenge student thinking. Providing hints, prompts, suggestions, and feedback when students encounter difficulties is encouraged at this stage.

Following this, targetted questioning is a useful way to check understanding and address misconceptions that students might have.

Anthony Bennett

Related posts: 

Using Images in Geography #1 Identify, classify, rank and justify

Using Images in Geography #2 Scroll it

Further reading

The Use of Scaffolds for Teaching Higher-Level Cognitive Strategies