https://www.internetgeography.net/wp-content/uploads/2022/07/Ice-Core-Lesson-by-Ewan-Vernon.png11861140Anthony Bennetthttps://www.internetgeography.net/wp-content/uploads/2024/01/Internet-Geography-Logo.pngAnthony Bennett2022-07-18 22:10:212026-06-16 14:56:07Ice Core Lesson by Ewan Vernon
This year we’re teaming up with schools across the UK to run the Geography Summer Challenge. The challenge aims to encourage young people (11-16) to engage in activities relating to geography over the 2022 summer holidays.
We’re encouraging schools like yours to run the competition across key stages 3 and 4. The competition involves students selecting ten activities from our menu of challenges and collecting evidence of completing each as they go along. Students then submit their entries to their school, where the best three are selected. Prizes could be awarded for first, second and third places. Each school is then invited to enter their best submission to the Internet Geography National Geography Summer Challenge. Internet Geography will choose the top three, and the winners will each receive a £30 Love to Shop voucher (you can read our terms and conditions here).
Students should be provided with a planning sheet which links to the student guide and menu. Once they have identified the challenges, they would like to complete, they then complete them. As they do this, they should gather evidence of completing each challenge. How students collate, this information is entirely up to you. For example, they could add their evidence to a single document, e.g. using Word/Google Docs etc., upload it to a folder on Google Drive, Microsoft Drive or a file sharing service such as DropBox or submit paper-based evidence. You know what will work best for your students.
Once you’ve judged your entries, send us your best Geography Summer Challenge entry by 29th September 2022. To enter the competition, you can either email the project to [email protected] or save the project to an online drive (e.g. Dropbox, Google Drive etc.) and send the link to [email protected] via an official teacher email account. The winner will be notified after 5th October 2022 via the email provided during submission.
We’d like to express a huge thank you to everyone who has suggested a Geography Summer Challenge idea. If you’ve got one to share, do let us know via the comments below or by emailing [email protected].
A special thanks to all our Internet Geography Plus subscribers who make projects like this possible! Not got a subscription? Go on, treat yourself and help us grow Internet Geography together. Sign up here.
The census happens every 10 years and gives us a picture of all the people and households in England and Wales.
On Sunday 21st March 2021 every household was required to complete the census, a detailed questionnaire asking a host of questions about those who live there. The Census questions ask for details on people’s sex, age, ethnicity and the status of their health, education and occupation.
The huge survey has been taking place every 10 years since 1801 (except in 1941), with the last one being in 2011.
The Census is run by the Office for National Statistics (ONS) in England and Wales and by the Northern Ireland Statistics and Research Agency. Scotland’s Census was delayed until March 2022 due to the coronavirus pandemic.
The Covid outbreak also means the Census in England, Wales and Northern Ireland was the first to be primarily completed online.
Census 2021 first results
The first results were published on Tuesday 28 June 2022. These are estimates of the number of people and households in England and Wales. They show the number of people by sex and age at the local authority level, rounded to the nearest 100.
On Census Day, the size of the usual resident population in England and Wales was 59,597,300.
The population of England was 56,489,800
The population of Wales was 3,107,500.
This was the largest the population has ever been.
Key findings of the first results
The population of England and Wales grew by more than 3.5 million (6.3%) since the last census in 2011, when it was 56,075,912.
The population grew in each of the nine regions of England and also grew in Wales; the region with the highest population growth was the East of England, which increased by 8.3% from 2011 (a gain of approximately 488,000 residents).
There were 30,420,100 women (51.0% of the overall population) and 29,177,200 men (49.0%) in England and Wales.
There were more people than ever before in the older age groups; the proportion of the population who were aged 65 years and over was 18.6% (16.4% in 2011).
There were 24,782,800 households in England and Wales on Census Day; the number of households increased by more than 1.4 million since 2011 (6.1%), when there were 23,366,044 households.
Population change between 2011 and 2021, local authorities in England and Wales
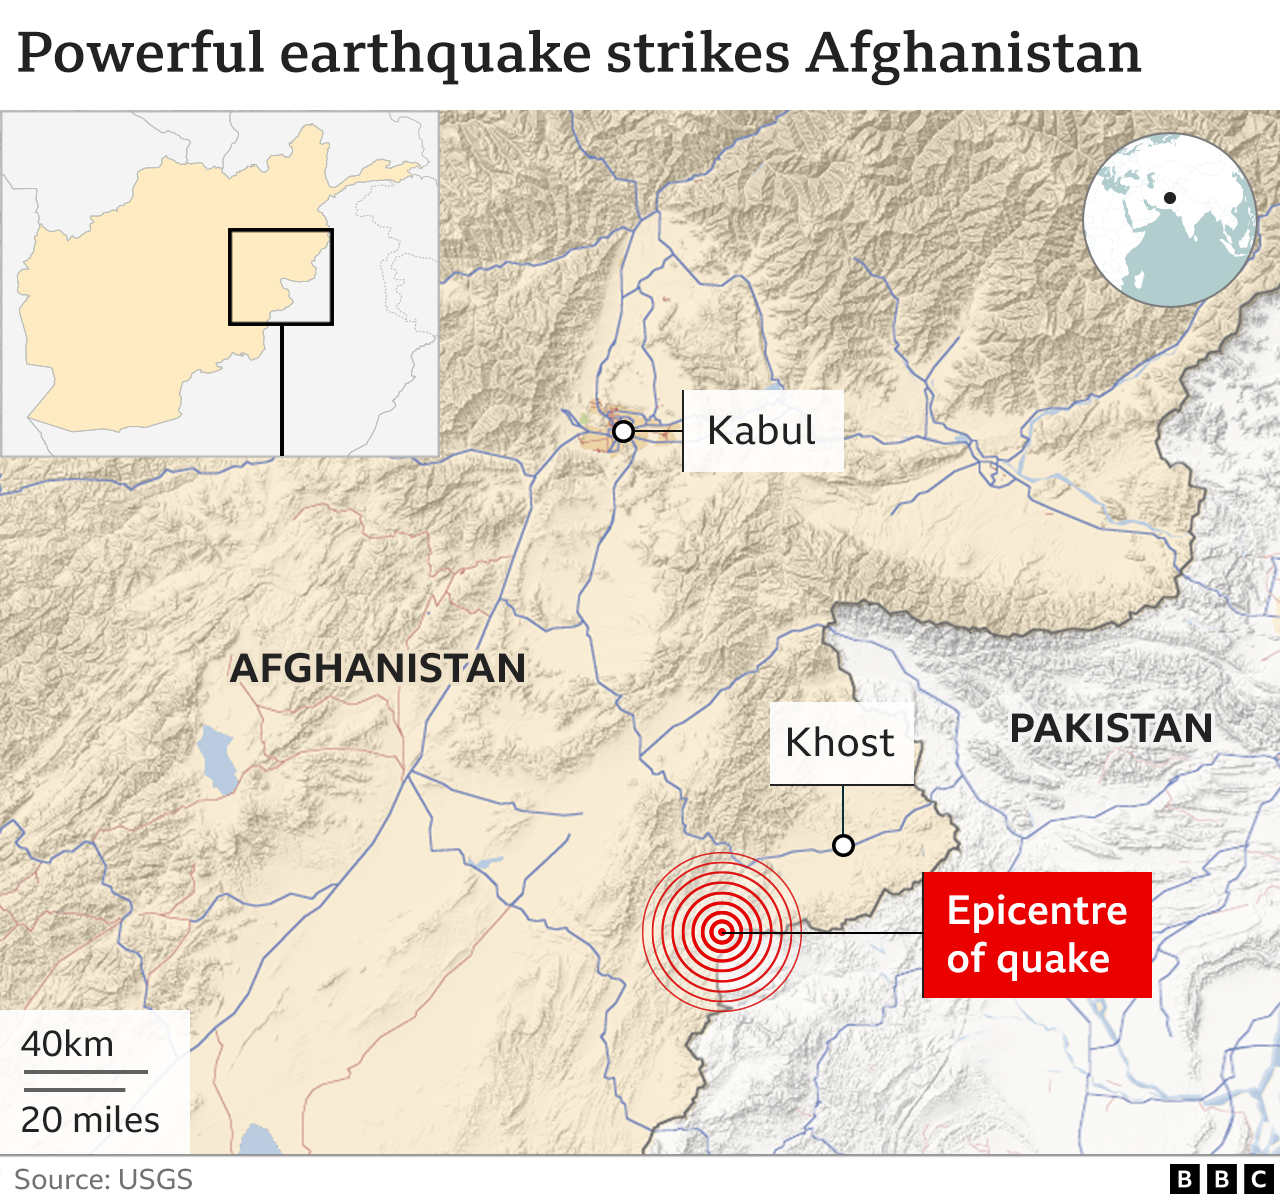
At least 1,036 people have died, and another 2,949 were injured in an earthquake that struck Afghanistan’s Paktika province on the morning of Wednesday 22nd June 2022. The earthquake struck about 44km (27 miles) from the south-eastern city of Khost shortly after 01:30 local time (21:00 Tuesday GMT), when many people were asleep at home.
Earthquakes are common in Afghanistan’s mountainous province of Khost — nearly 50 have been recorded over the past five years, according to the US Geological Survey.
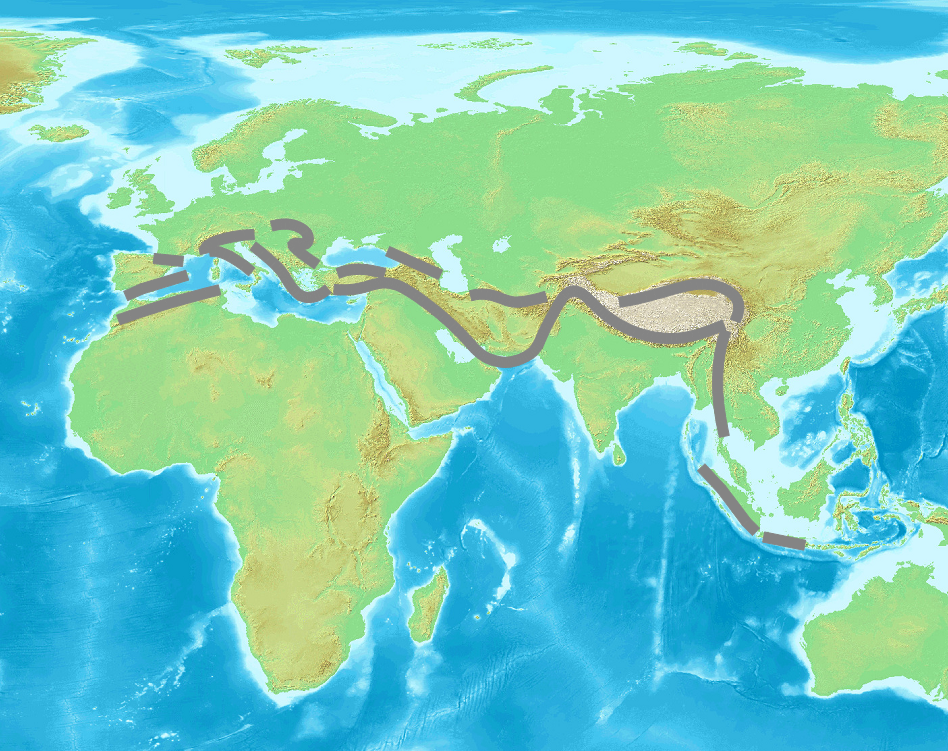
Afghanistan is earthquake-prone because it is located on the Alpide belt, the second most seismically active region in the world after the Pacific Ring of Fire.
The Alpide Belt
The Alpide belt runs about 15,000 kilometres, from the southern part of Eurasia through the Himalayas and into the Atlantic. Along with the Hindu Kush, it includes a number of fold mountain ranges, such as the Alps, Atlas Mountains and the Caucasus Mountains. It has been formed by the collision of a number of tectonic plates.
The Arabian, Indian and Eurasian tectonic plates meet In Afghanistan and create earthquakes when they shift against each other at their borders. The boundary between the Indian and Eurasian plates exists near Afghanistan’s border with Pakistan.
The earthquake in Afghanistan formed when the Indian plate crashed violently with the Eurasian plate. Collisions like this shake and squeeze the ground upwards. Along with causing earthquakes, this movement creates mountains like the Himalayas or the Hindu Kush and Pamir mountain ranges in northeast Afghanistan.
What were the effects of the Afghanistan earthquake?
The most recent figures put the death toll at 1,150 people with at least 1,600 injuries. The number of dead and injured is expected to rise as remote areas are reached and rescue workers are able to search collapsed buildings.
The earthquake destroyed critical infrastructure — including homes, health facilities, schools and water networks.
In the areas that have been accessed so far, as many as 1,900 homes have been destroyed including 1,028 in Giyan, 450 in Barmal and 416 in Spera. Many homes had large families of seven or more people, so the number of people affected is significant. This is well over half of Giyan’s housing stock.
As many as 10,000 more homes have been damaged extensively and risk imminent collapse. Many of the homes were comprised of mud bricks, making them very susceptible to damage and destruction. Ongoing assessments of the conditions of the housing are continuing.
At least 65 children have been orphaned or are unaccompanied in the aftermath of the earthquake.
Of the deaths, at least 155 were children, including 134 in the Giyan district, and 250 were injured. Seven schools in Khost and Paktika provinces were damaged by the earthquake (5,135 students) with additional damage reported in Gani Khil and Dor Baba districts.
The risk of communicable diseases, such as acute watery diarrhoea (AWD)/cholera, and malaria increased due to the fragile living conditions in the affected communities and high temperatures in summer. There was an upward trend of AWD cases following the earthquake (Between 3 to 10 July, a total of 464 AWD cases were reported).
What were the responses to the Afghanistan earthquake?
Since the take over of government by the Taliban in 2021, Afghanistan has experienced a humanitarian crisis, especially since many countries cut diplomatic ties with the country. The new regime has struggled to get to grips with food shortages and a flailing economy. More than a third of people cannot meet their basic needs, women’s rights have been restricted and foreign aid has evaporated.
Dr Orzala Nemat, an Afghan researcher and human rights activist based in the UK, fears that the response could quickly become chaotic without “systematic governance” structures in place since the Taliban takeover.
In a rare move, the Taliban’s supreme leader, Haibatullah Akhundzadah, who almost never appears in public, pleaded with the international community and humanitarian organisations “to help the Afghan people affected by this great tragedy and to spare no effort”.
Afghanistan’s Taliban rulers pledged not to interfere with international efforts to distribute aid to tens of thousands of people affected by the earthquake.
Humanitarian aid has continued, with international agencies, such as the United Nations, operating.
The UN Office for the Coordination of Humanitarian Affairs (UNOCHA) said Afghanistan had asked humanitarian agencies to help with rescue efforts, and teams were being sent to the quake-hit area.
Afghanistan military provided support in search and rescue operations.
International Aid
Japan, South Korea, Taiwan and the United Arab Emirates all offered to send aid. Supplies from neighbouring Pakistan crossed the border.
On July 12, the Government of Japan decided to extend Emergency Grant Aid of 3 million US dollars to Afghanistan in response to the damages caused by the earthquake that had occurred in eastern Afghanistan on June 22. The Government of Japan offered to provide assistance in areas such as health and medical care, shelter, and water and sanitation through the International Federation of Red Cross and Red Crescent Societies (IFRC) to the Afghan people affected by the devastating earthquake.
Non-Government Organisations (NGOs)
The World Health Organisation’s polio team was on the ground joining forces with UN agencies and NGOs to ensure an effective and coordinated relief effort. The team’s invaluable experience and local knowledge gained from more than 2 decades working among local communities in both Paktika and Khost provided the foundations of an assessment tool to map communities (the Open Street Map Humanitarian team issued a request from arm-chair mappers to use satellite images to create and update maps in the area) and assess the number and extent of casualties as well as the destruction to homes and buildings. This ensured accurate data guided a focused response in the immediate aftermath, including the rapid construction of tents for shelter, as well as housing ad hoc health camps.
Polio teams turned a helping hand wherever needed including digging for survivors, building tents, unpacking trucks and distributing shipments of WHO emergency and surgical kits, medical supplies and equipment, and the heartbreaking task of preparing and assisting in transporting the dead for burial.
A new EU Humanitarian Air Bridge flight delivered 36 tonnes of life-saving cargo consisting of medical equipment, medication, and relief items to support WHO, UNICEF and Médecins Sans Frontières delivering earthquake response and other humanitarian needs in Afghanistan.
Below is the start of a collection of resources to support educating students about the earthquake in Afghanistan. Please let us know about other resources in the comments below.
Afghanistan Earthquake Relief
While many relief agencies are currently not providing support to Afghanistan there are a number of organisations providing support. These include:
If you are aware of other aid agencies providing support or are able to provide a link for donations to aid agencies please send us an email.
Support
Teachers
Below we have included links to websites that provide support in teaching events such as this in a considered way, after all, there are a number of children from Afghanistan being educated in schools outside of the country and may be in one of your classes.
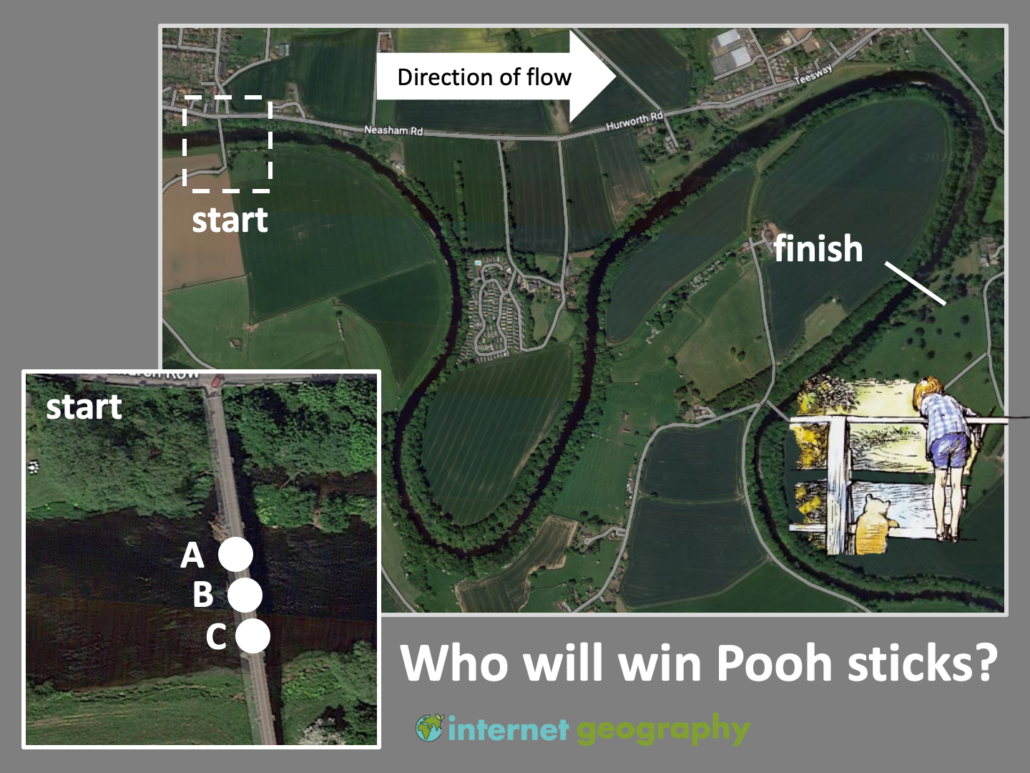
Check learner understanding of the velocity of a river where there are meanders with this simple activity. Great for discussions and application of geographical understanding of river processes.
Click the image below to download the PowerPoint slide.
With the cost of living crisis, OS Maps offers endless days out to explore and have fun outdoors. And, right now you can subscribe for just £1 for 1 month using voucher code OSMONTH – perfect for the Jubilee bank holiday weekend!
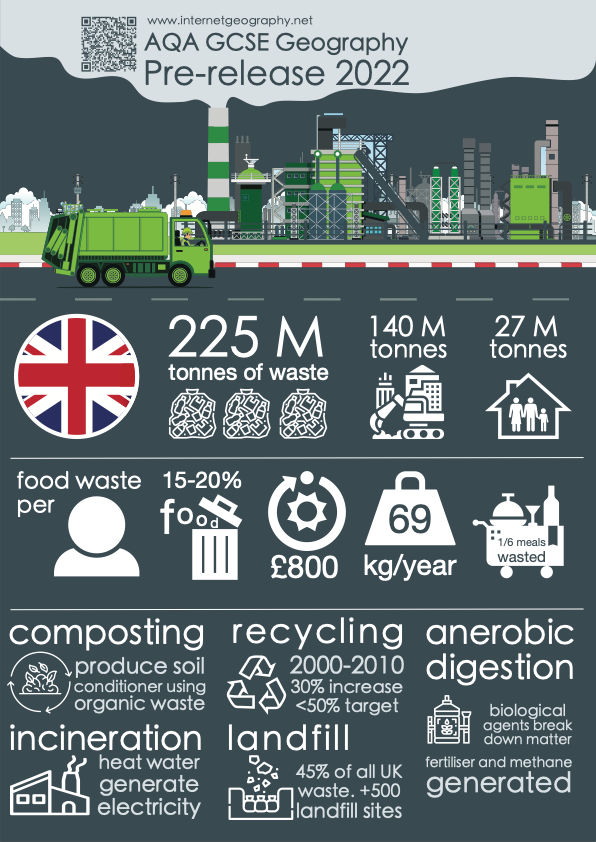
We’ve developed the first in a planned series of infographics covering the AQA GCSE geography paper 3 2022 pre-release. Ideal for display in the classroom (and bedrooms!). The QR code takes students to interactive resources we are developing.
Other infographics will be made available to Internet Geography Plus subscribers who already have access to three work booklets to support students in familiarising themselves with and understanding the pre-release. Take out a low-cost annual subscription starting at just £24.99.
Welcome! We are developing a range of resources to support students and teachers in preparing for the AQA GCSE Geography pre-release. This page will be regularly updated over the next few days.
Three people died in one of the worst storms to hit the UK in decades. Storm Eunice, sandwiched between Storms Dudley and Frankline brought record-breaking winds to the UK.
Over the course of one week, the big three, Storms Dudley, Eunice and Franklin battered the UK during February 2022.
About 400,000 homes were without power on the evening of Friday 18th February 2022.
What caused Storm Eunice?
The UK’s recent cluster of winter wind storms is related to a particularly strong polar vortex creating low pressure in the Arctic, and a faster jet stream – a core of very strong wind high in the atmosphere that can extend across the Atlantic – bringing stormier and very wet weather to the UK.
A stronger jet stream makes storms more powerful and its orientation roughly determines the track of the storm and where it affects.
The storms were predicted to contain a “sting jet”: a small, narrow airstream that can form inside a storm and produce intense winds over an area smaller than 100 km.
Sting jets, which were first discovered in 2003, and likely occurred during the Great Storm and Storm Arwen, can last anywhere between one and 12 hours. They are difficult to forecast and relatively rare, but make storms more dangerous.
Sting jets occur in a certain type of extratropical cyclone – a rotating wind system that forms outside of the tropics. These airstreams form around 5km above the Earth’s surface then descend on the southwest side of a cyclone, close to its centre, accelerating as they do and bringing fast-moving air from high in the atmosphere with them. When they form, they can produce much higher wind speeds on the ground than might otherwise be forecast by studying pressure gradients in the storm’s core alone.
Meteorologists are still working to understand sting jets, but they are likely to have a significant influence on the UK’s weather in a warming climate.
What were the impacts of Storm Eunice?
Three people died in the UK in Storm Eunice on Friday as fierce winds toppled trees and sent debris flying.
With many railway lines blocked by trees and other debris, major train operators – including Chiltern Railways, Avanti West Coast and Great Western Railway – were forced to suspend services, while in Wales all trains were cancelled.
West Coast mainline services have also been affected after the temporary closure of Preston railway station, where roofing became loose.
Network Rail recorded about 200 storm-related incidents between London Paddington and Penzance in Cornwall in recent days, adding that the number of incidents was unprecedented and some of the worst the UK has experienced in three decades
The top of the spire at St Thomas’s Church in Wells, Somerset, toppled to the ground.
#STORMEUNICE It’s a miracle that this sizeable & very heavy spire tip, with windvane & lightning conductor, didn’t hit anyone as it came crashing-down at St Thomas Church in #Wells, #Somerset around noon. Video captured by Matthew Hodson (many thanks for sending to @BBCBristol) pic.twitter.com/fq2KfvpWBR
In Shropshire, people were rescued and properties evacuated due to flooding and at Ironbridge two severe flood warnings were issued – meaning lives are in danger and the Severn barriers are expected to be breached.
The Wharfage Road in Ironbridge – which runs alongside the river – was closed to pedestrians, as it is no longer safe behind the barriers erected there, the Environment Agency said.
The River Severn peaked at 16.9ft (5.15m) in the Shrewsbury area, 3.9 inches (10cm) short of the record levels set in 2000, and parts of the town centre have been underwater.
The River Wharfe overtopped its banks in Tadcaster, North Yorkshire, leading to flooding.
A second red warning, meaning there is a threat to life has been issued by, covering South East England and London. Severe weather will affect most of the UK today from #StormEunice. Alex Deakin has the details pic.twitter.com/zIYjK2zyAl
What were the long-term responses to Storm Eunice?
Insurance payouts for damage caused by Storm Eunice could total between £200m and £350m, according to early estimates from the consultancy firm PwC.
Mohammad Khan, General Insurance Leader at PwC UK, said insurance losses would mainly relate to “damage to homes, commercial properties and vehicles from falling trees and flying debris”.
https://www.internetgeography.net/wp-content/uploads/2022/02/O2-Arena-Damaged-by-Storms.jpeg40006000Anthony Bennetthttps://www.internetgeography.net/wp-content/uploads/2024/01/Internet-Geography-Logo.pngAnthony Bennett2022-02-25 12:46:042022-02-25 12:46:04Storm Eunice Case Study
Seismic tomography scans have huge potential in the geography classroom. But what are they? In simple terms, they are like a CAT scan of the interior of the Earth. They are created by measuring the speed of seismic waves. Areas, where there is a low velocity, correspond with hotter, less dense zones in the mantle (e.g. a mantle plume). To find out more about seismic tomography scans take a look at this excellent guide by Earth Scope.
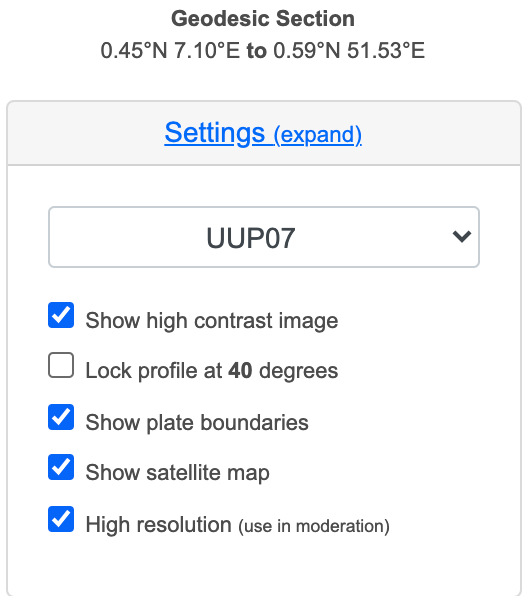
There are a number of tools available to generate seismic tomography scans. Our favourite is the Hades Underworld Explorer. The interface is made to facilitate the discovery and visualisation of mantle anomalies. A tomographic model can be generated by either selecting a section preset or by dragging markers to generate a cross-section of the mantle.
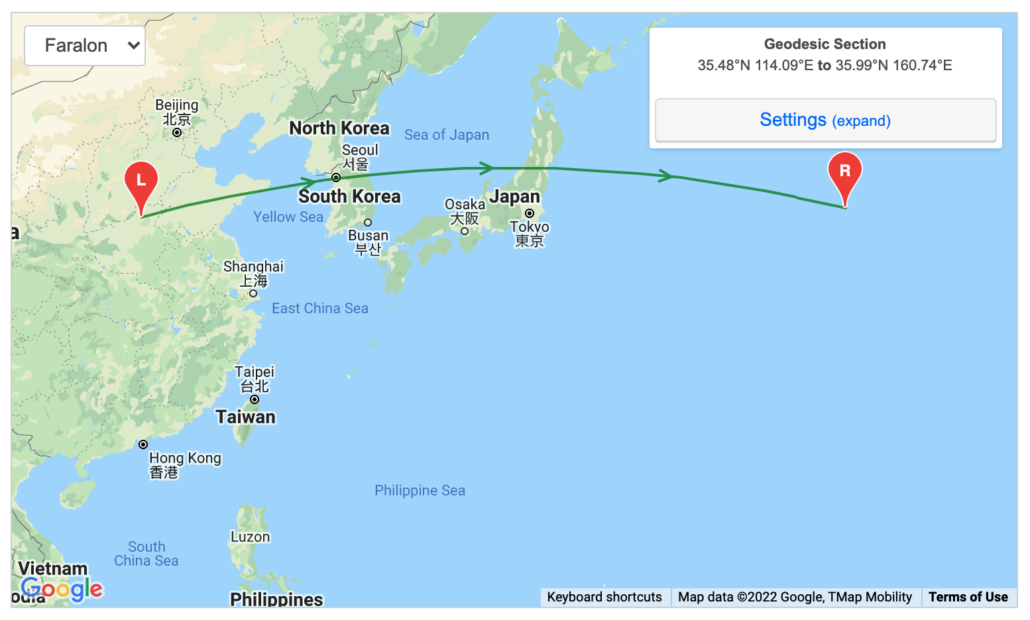
In the example below, a selection has been made in the northwest Pacific, in Asia.
A selection in the north-west Pacific
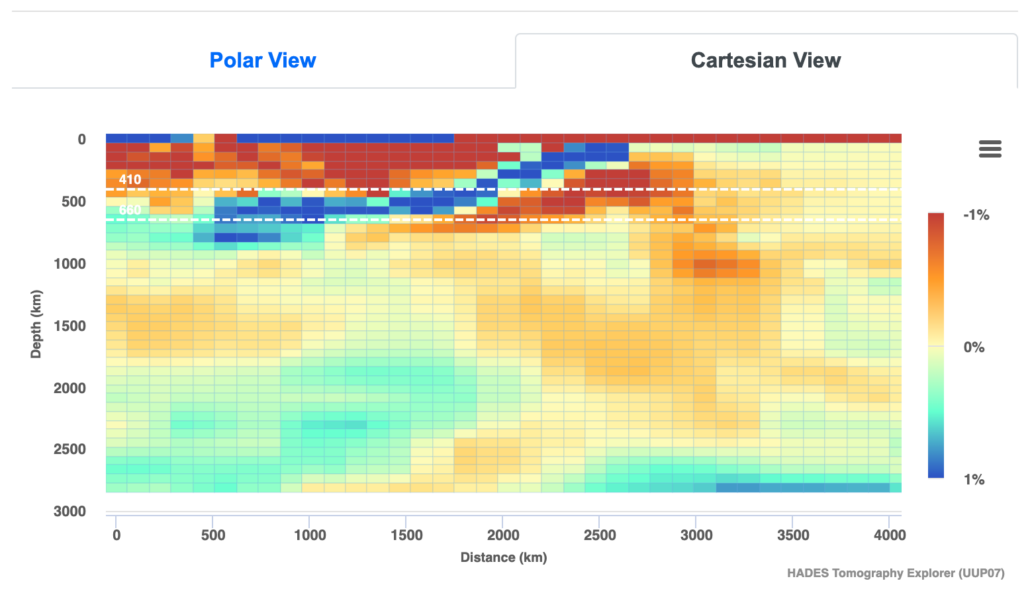
The website then generates a tomography scan showing the cross-section of the mantle.
The subduction of the Eurasian plate by the Pacific Plate
The depth of the mantle is shown in kilometres on the x-axis. The key shows velocity anomalies. In the case of the tomography scan above the colder, more dense material is shown in blue, while the hotter, less dense material is shown in red. Based on this we can see the destructive margin formed by the Eurasian plate being subducted by the Pacific plate. The Pacific Plate sinking into the mantle as illustrated by the cooler crust (shaded blue), reaches a depth of around 800 km.
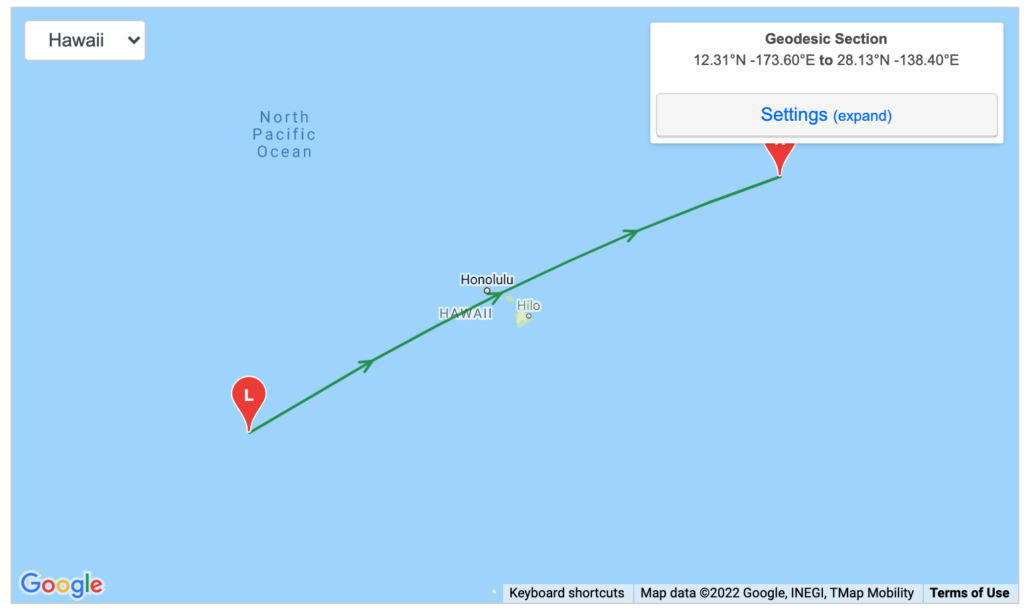
In the example below the mantle plume at Hawaii is clearly visible (accessed via the drop-down menu).
Hawaii
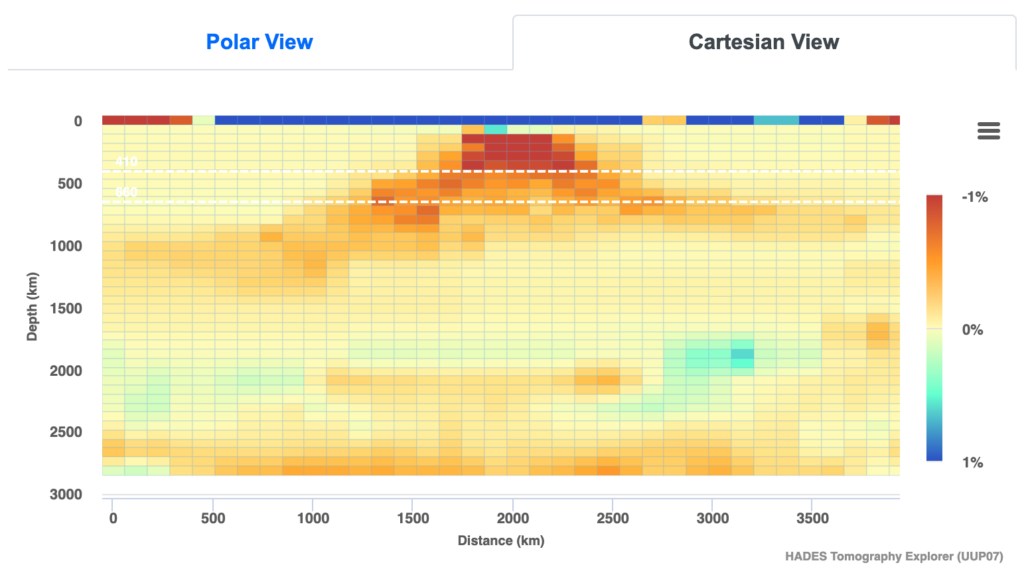
Hawaii mantle plume
Tomography scans lack the resolution required to image plumes deep within the mantle.
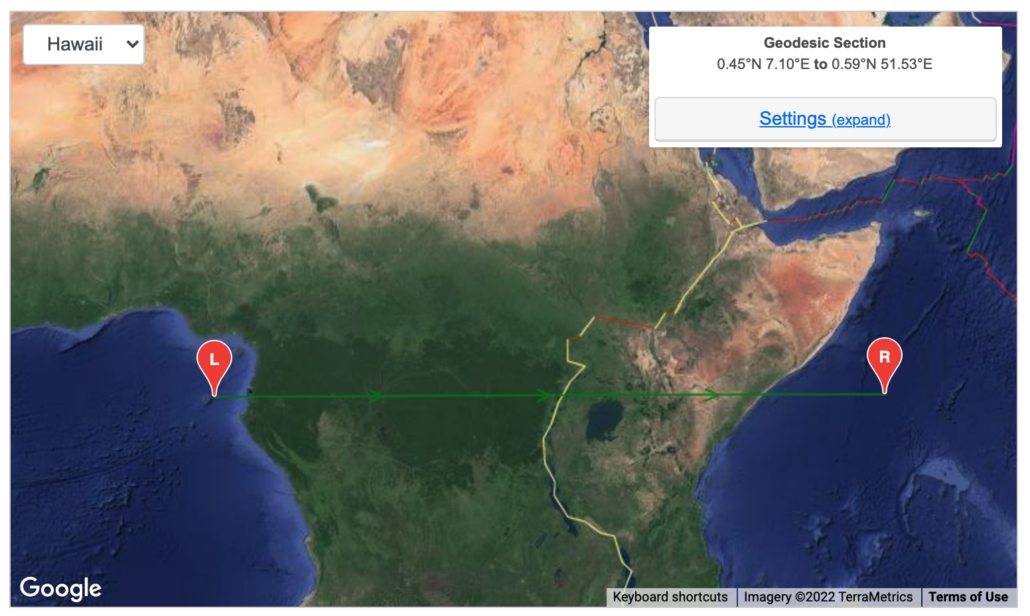
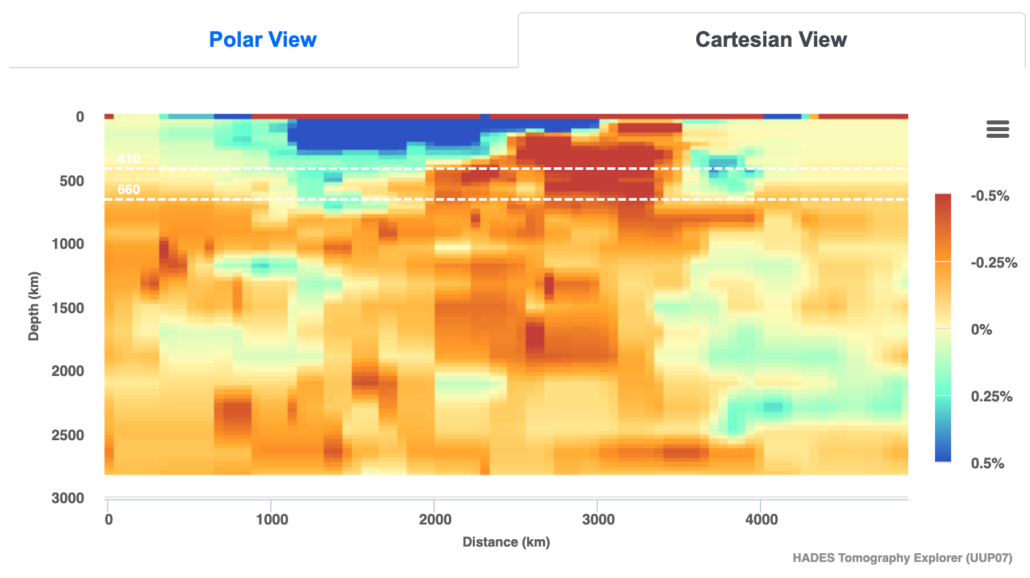
The tomography scan below illustrates the Rift Valley in eastern Africa.
Rift valley transect
Rift valley tomography scan
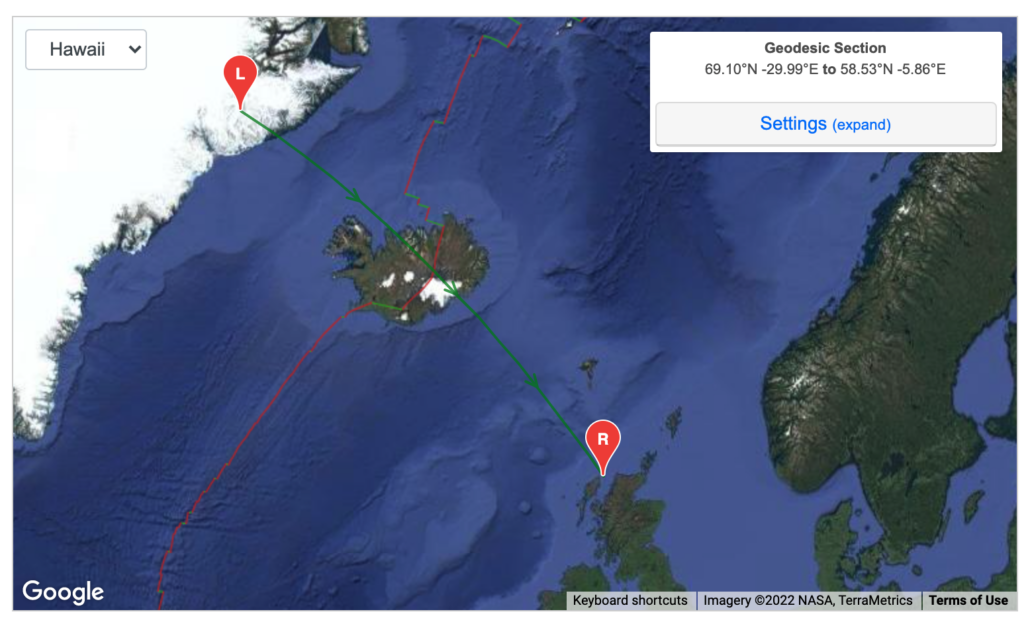
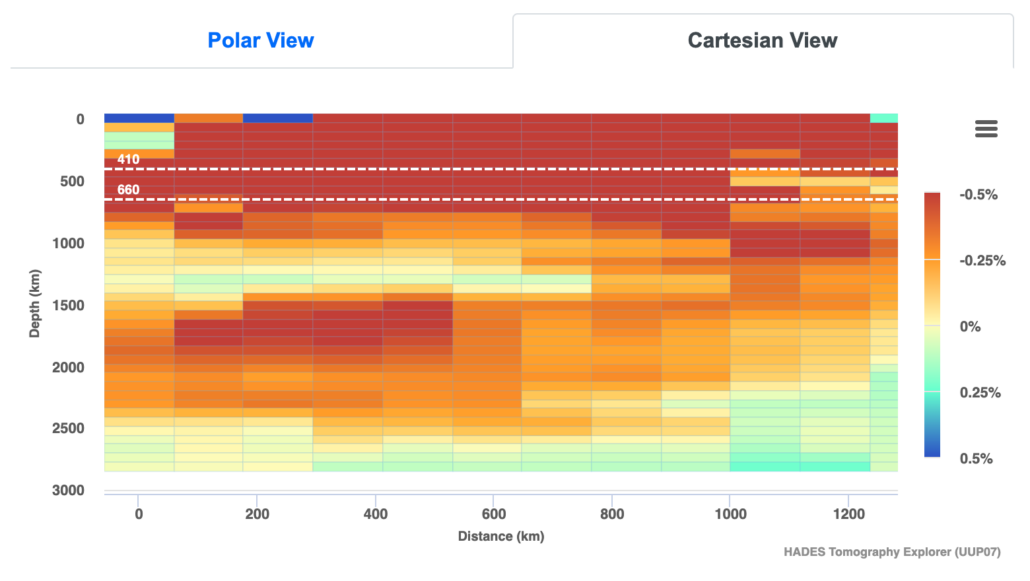
The tomography scan below shows the Northern Atlantic.
North Atlantic Transect
North Atlantic Tomography scan
In the tomography scan above we can see that the conduit spreads laterally across the North Atlantic, to a depth of around 900 km. There is a conduit feeding this between 900-1200 km along the transect at a depth of around 1000 – 1500 km.
Alistair Hamill has shared a number of resources on the use of seismic tomography on Twitter and inspired our interest in this area. Below are a selection of tweets by Alistair that are well worth exploring.
I think that tomography scans of the mantle are a great way to teach our A Level geographers our latest understanding of the processes down there. If tomography is new to you, check out this annotated scan of the Iceland mantle plume for a sense of what it can reveal. pic.twitter.com/RYzzEkox0M
1/ My Y13s had their first explore of seismic tomography today, using Atlas of the Underworld to draw a series of cross sections through the mantle to find evidence of subducting plates. I’ve been so looking forward to doing this with them – and they nailed it!!