Hades Tomography Explorer
Seismic tomography scans have huge potential in the geography classroom. But what are they? In simple terms, they are like a CAT scan of the interior of the Earth. They are created by measuring the speed of seismic waves. Areas, where there is a low velocity, correspond with hotter, less dense zones in the mantle (e.g. a mantle plume). To find out more about seismic tomography scans take a look at this excellent guide by Earth Scope.
There are a number of tools available to generate seismic tomography scans. Our favourite is the Hades Underworld Explorer. The interface is made to facilitate the discovery and visualisation of mantle anomalies. A tomographic model can be generated by either selecting a section preset or by dragging markers to generate a cross-section of the mantle.
In the example below, a selection has been made in the northwest Pacific, in Asia.
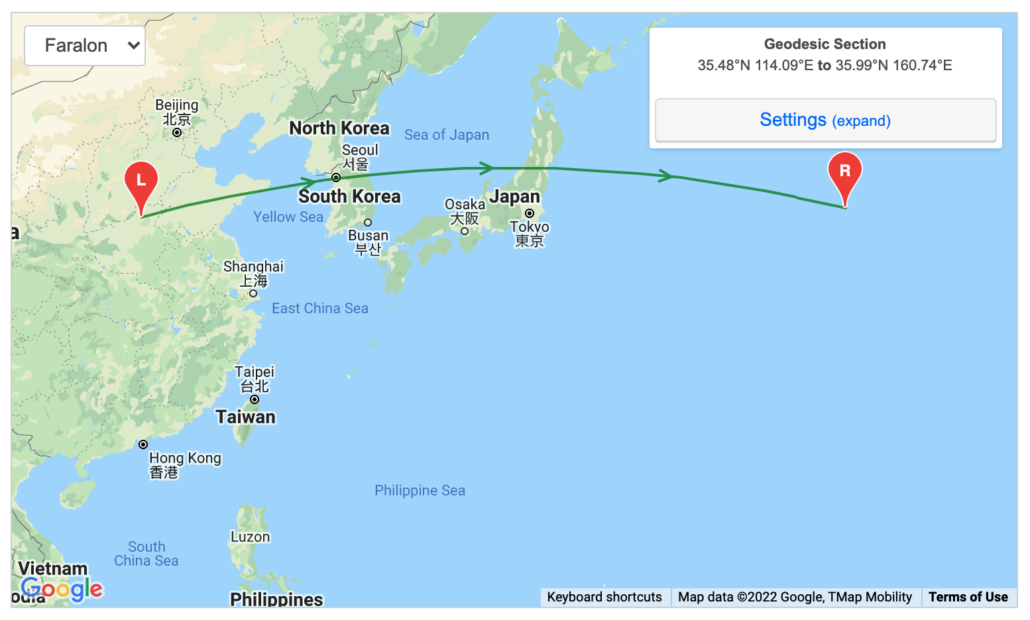
A selection in the north-west Pacific
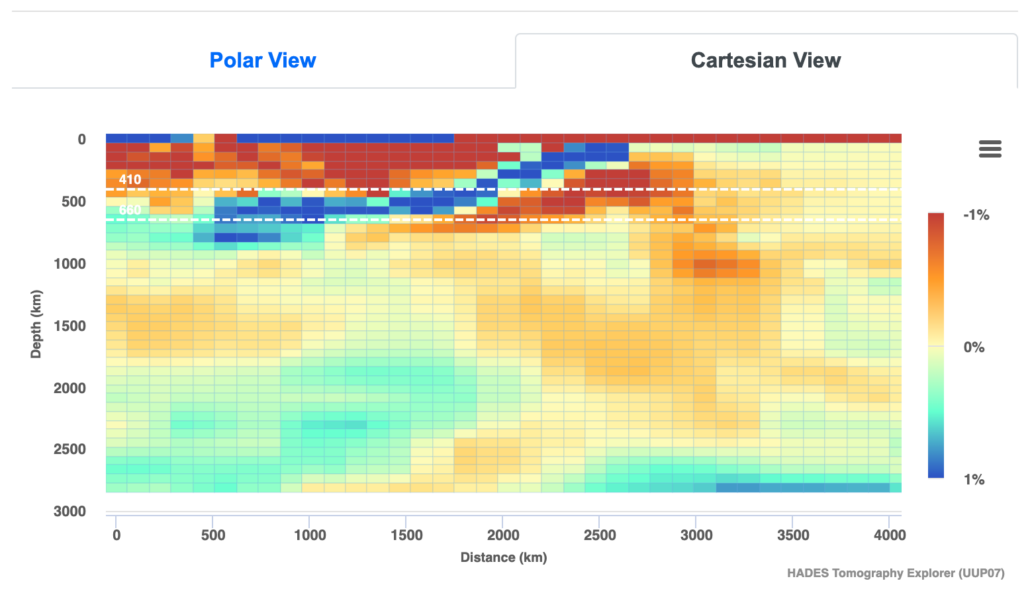
The website then generates a tomography scan showing the cross-section of the mantle.
The subduction of the Eurasian plate by the Pacific Plate
The depth of the mantle is shown in kilometres on the x-axis. The key shows velocity anomalies. In the case of the tomography scan above the colder, more dense material is shown in blue, while the hotter, less dense material is shown in red. Based on this we can see the destructive margin formed by the Eurasian plate being subducted by the Pacific plate. The Pacific Plate sinking into the mantle as illustrated by the cooler crust (shaded blue), reaches a depth of around 800 km.
In the example below the mantle plume at Hawaii is clearly visible (accessed via the drop-down menu).
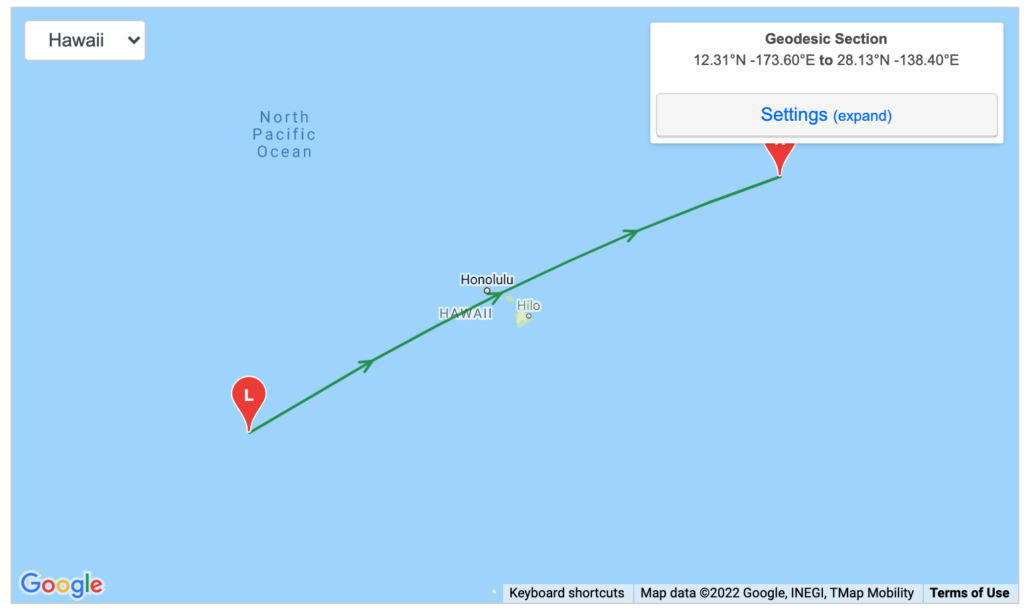
Hawaii
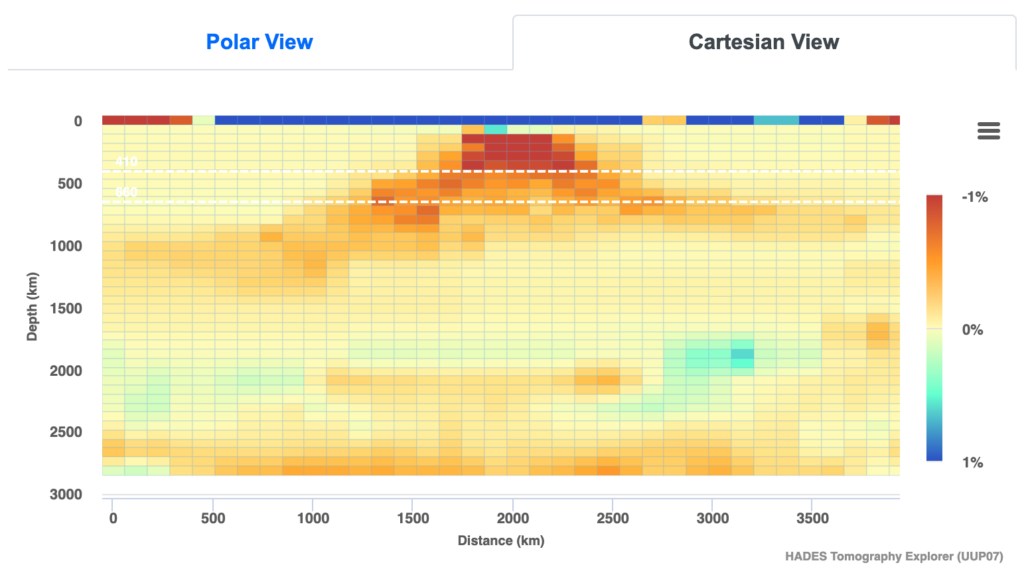
Hawaii mantle plume
Tomography scans lack the resolution required to image plumes deep within the mantle.
The tomography scan below illustrates the Rift Valley in eastern Africa.
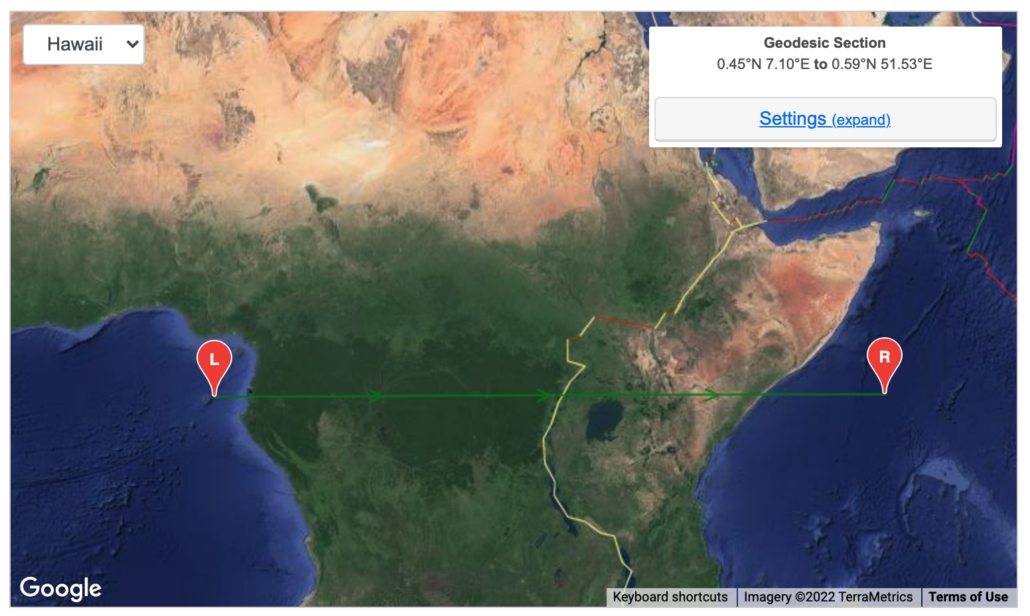
Rift valley transect
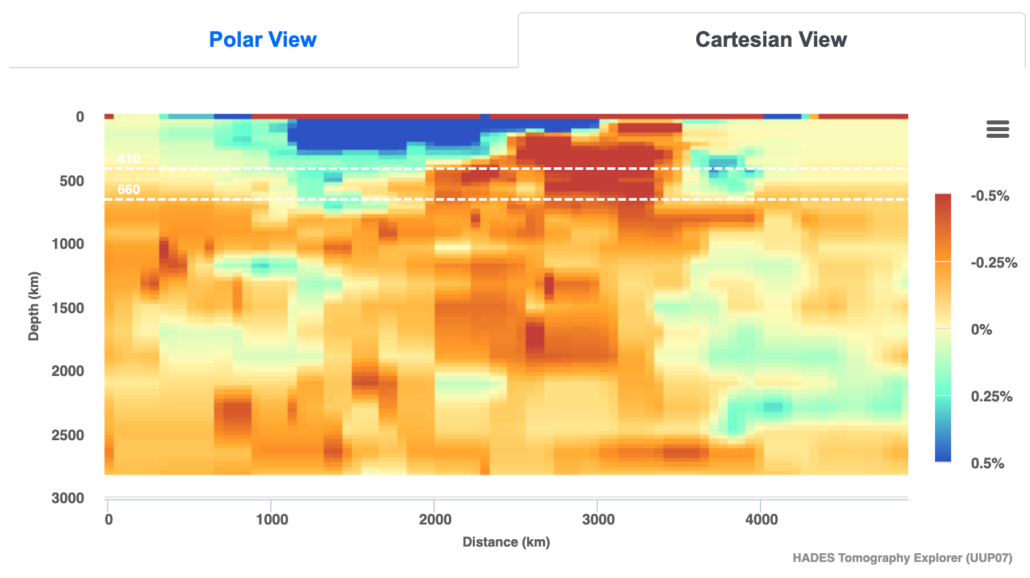
Rift valley tomography scan
The tomography scan below shows the Northern Atlantic.
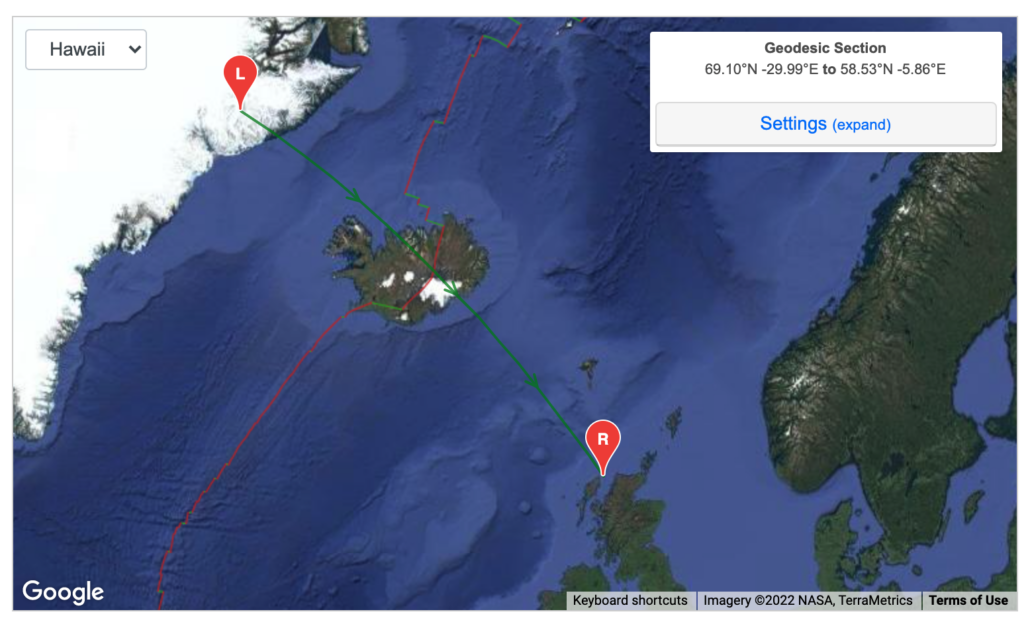
North Atlantic Transect
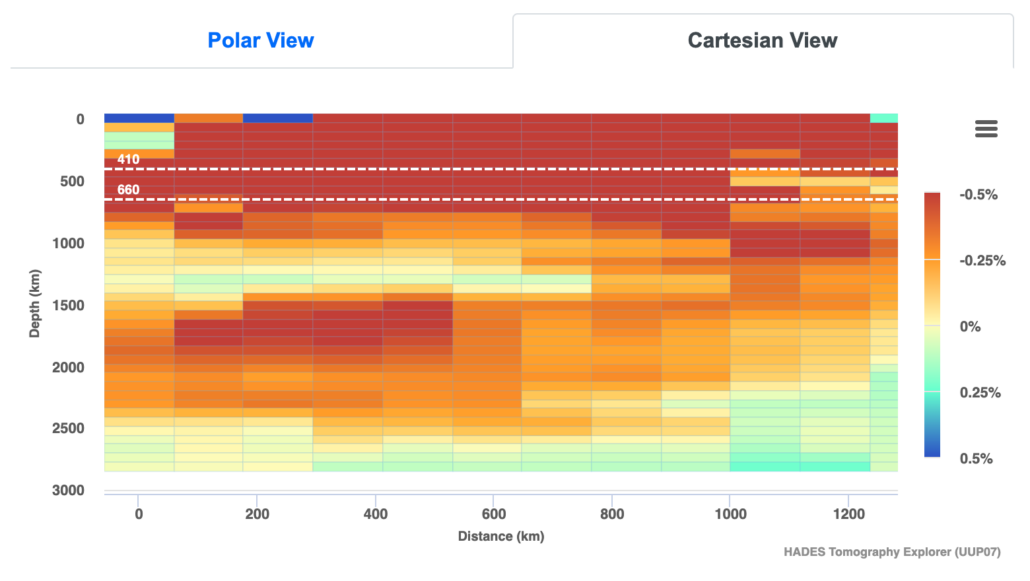
North Atlantic Tomography scan
In the tomography scan above we can see that the conduit spreads laterally across the North Atlantic, to a depth of around 900 km. There is a conduit feeding this between 900-1200 km along the transect at a depth of around 1000 – 1500 km.
Note: The settings in the Hades Underworld Explorer allow you to customise your tomography scan.
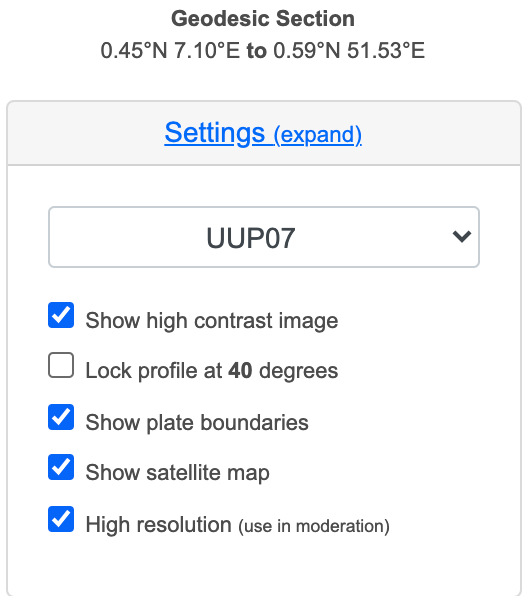
Tomography Scan Settings
Alistair Hamill has shared a number of resources on the use of seismic tomography on Twitter and inspired our interest in this area. Below are a selection of tweets by Alistair that are well worth exploring.
I think that tomography scans of the mantle are a great way to teach our A Level geographers our latest understanding of the processes down there. If tomography is new to you, check out this annotated scan of the Iceland mantle plume for a sense of what it can reveal. pic.twitter.com/RYzzEkox0M
— Alistair Hamill (@lcgeography) September 14, 2021
1/ My Y13s had their first explore of seismic tomography today, using Atlas of the Underworld to draw a series of cross sections through the mantle to find evidence of subducting plates. I’ve been so looking forward to doing this with them – and they nailed it!!
Short thread pic.twitter.com/WKleyBwJVO
— Alistair Hamill (@lcgeography) September 30, 2021
Interesting article on what higher resolution tomography scans have revealed about the details of how subduction is happening below Mt Rainier. https://t.co/E9ExtFxZ2t pic.twitter.com/Wd4Cx8SpXu
— Alistair Hamill (@lcgeography) October 7, 2021
Take a look at Alistair’s timeline on Twitter to see how he has used them in his classroom.
If you know of resources to support the use of seismic tomography scans please share them in the comments below.


Leave a Reply
Want to join the discussion?Feel free to contribute!