Increasing ‘word consciousness’ in the geography classroom
Guest blogger Abdurrahman Pérez (@mr_perez5) discusses his strategies for increasing ‘word consciousness’ in the geography classroom.
What struck me the most while reading Alex Quigley’s (@HuntingEnglish) fantastic ‘Closing the Vocabulary Gap’ (aside from the inspiring reminder of the duty we have to disadvantaged children to better their vocabulary) was the focus on explicit vocabulary teaching. He wants us to make our pupils more ‘word conscious’, and in Episode 13 of ‘The Staffroom’ podcast, he described words as possessing “layers of meaning” and teachers needing to be explicit with students about these when helping them understand specific vocabulary.
Simply put, we cannot just expect them to know, retain and use words magically. We cannot assume. We cannot leave it to anyone else. If you want your pupils to confidently breakdown dense texts, write superb answers to increasingly complex exam questions or to generally be able to understand, analyse and cogently explain (either in writing or verbally) the world around them (as good geographers do), then we need to go about teaching this deliberately. I think some teachers shy away from this – and some say they ‘do not have time to teach vocabulary, isn’t that for English teachers?’ – however, ultimately, it is obvious:
A. You are the expert in the room.
B. Your pupils deserve to be challenged.
Word consciousness
That is why my department and I are focusing on keywords and command words at GCSE and A-Level. In truth, I had begun to do this before reading ‘Closing the Vocabulary Gap’, but anyone who has read it will know that Alex provides you with a thousand and one brilliant practical ways to refine your approach to teaching vocabulary, many of which I’ll take up myself this coming year and use to improve this resource. Without wanting to explicitly make the activity fun – after all, any geography teacher will tell you any and all geography-related content is fun (right?) – it has become a little bit of a game, more so with GCSE actually. I am still developing my A-Level approach so I’ll actually only discuss what I do with my Year 10s and 11s.
The goal of this is that the more familiar your pupils are with key terms (or command words), the more comfortable they are with using them verbally and – most importantly – in an exam setting. Obviously, take that with a pinch of salt, I say ‘most importantly’ simply because this concerns GCSE pupils and I understand a lot of you will not see exam performance as the ‘most important’ thing. Ultimately, you are equipping them with the tools to be able to succeed as geographers – because without a robust vocabulary, they will not be able to communicate their wonderful ideas as well as you want them to.
The aim of the game is simple, identify key terms from their definitions. However, its importance to our approach to interleaving to aid long-term memory and recall, as well as the benefits it has on mock exam/exam question performance is unreal. It has variations, of course, and that’s what the printed cards are for (see Google Drive link below): I can get the whole class to complete a pack (e.g. 3.2.1 Urban Issues and Challenges) with me standing at the front giving clues before the bell rings after we’ve packed away, or I can give a pack to pupil, and they have play Articulate with their partner, or I send one pile of cards around the class and we have to get to the person at the back as quickly as possible with only 3 passes – the possibilities are endless. Two things need to stay at the forefront of your teaching whilst doing this, though:
1. Increase the challenge: if they know the words too well after a while, start asking to follow up or probing questions to embed their understanding and fluency with the vocabulary.
2. Do it often: you need to be doing this often but in a planned manner. That way, in an ideal world, your lesson began with the increasingly popular recall Do Now quizzes (e.g. Geog Your Memory, which is @Jennnnnn_x’s I believe?) or the amazing Find it and Fix it (not sure who made this one!) which focused on a variety of past and present topics, and then ends with you picking a set of key terms from the topic you did, say, last half-term and quickly testing your class.
Increase the challenge
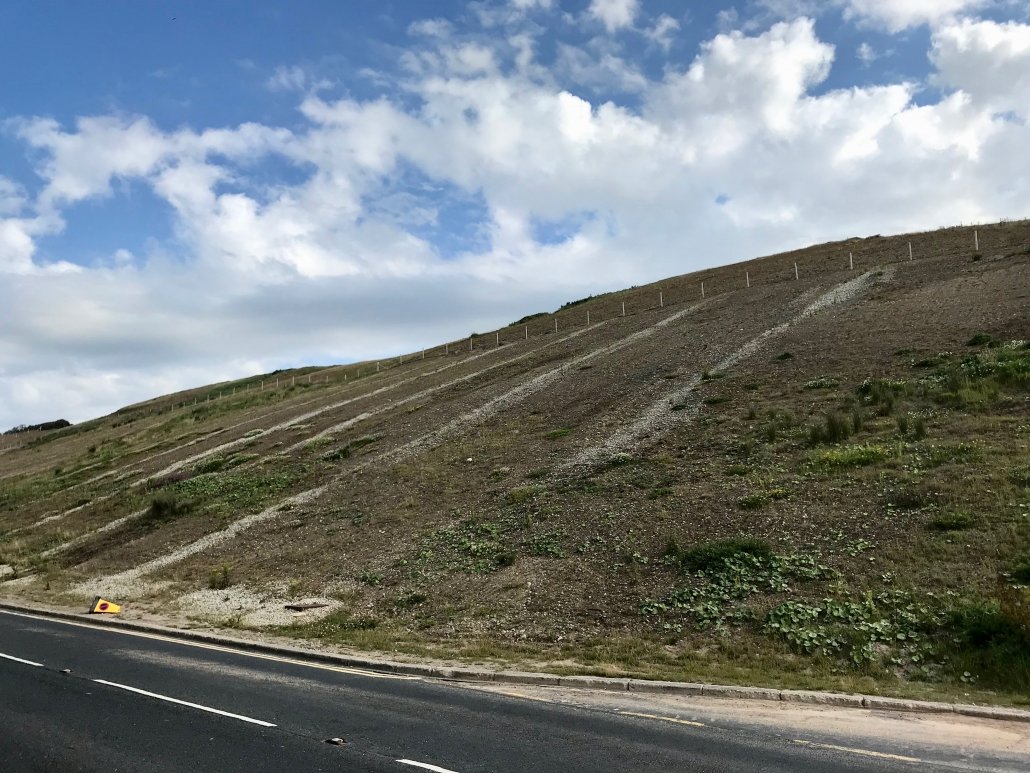
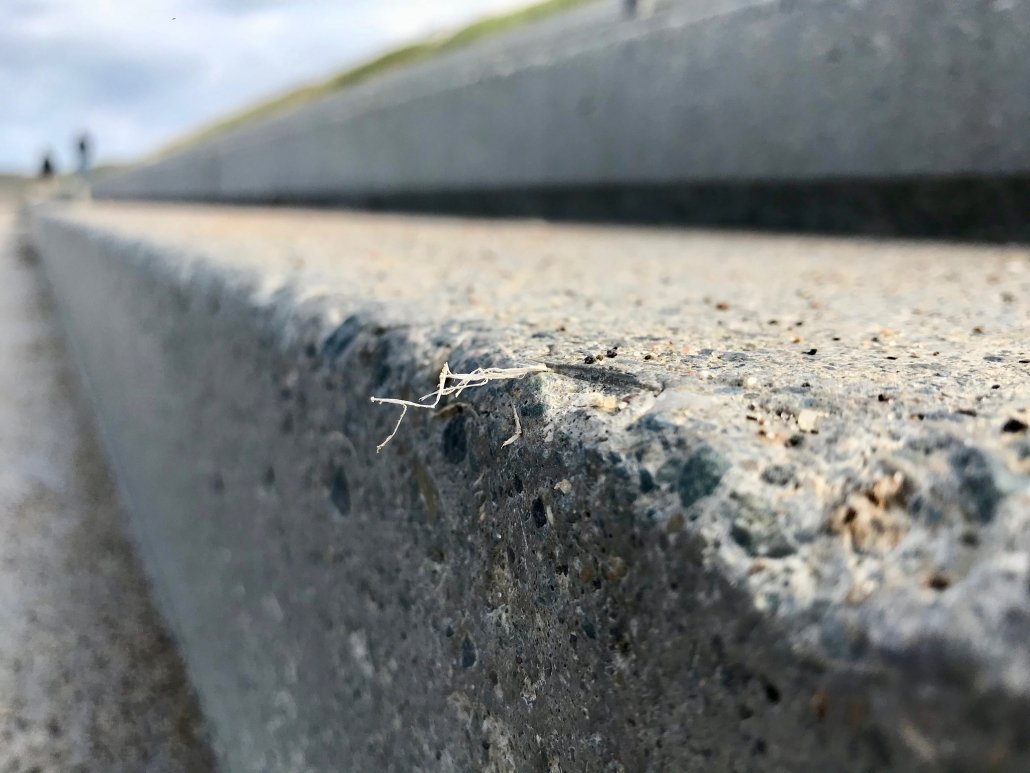
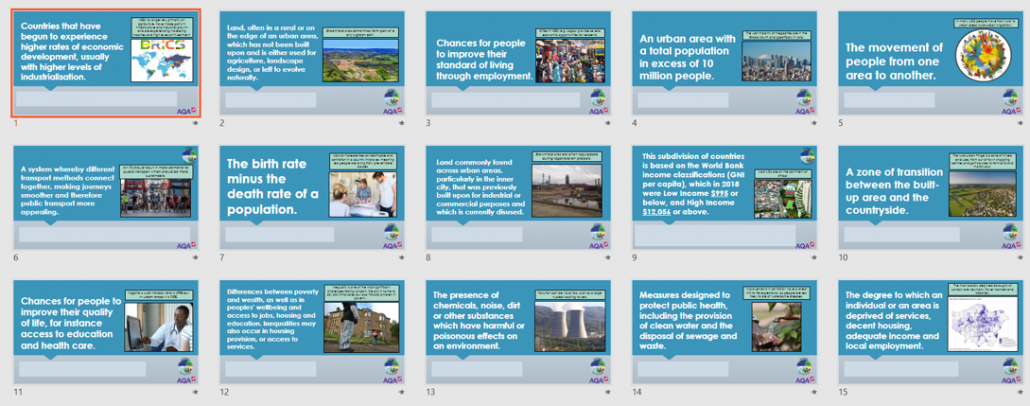
Example of increasing the challenge
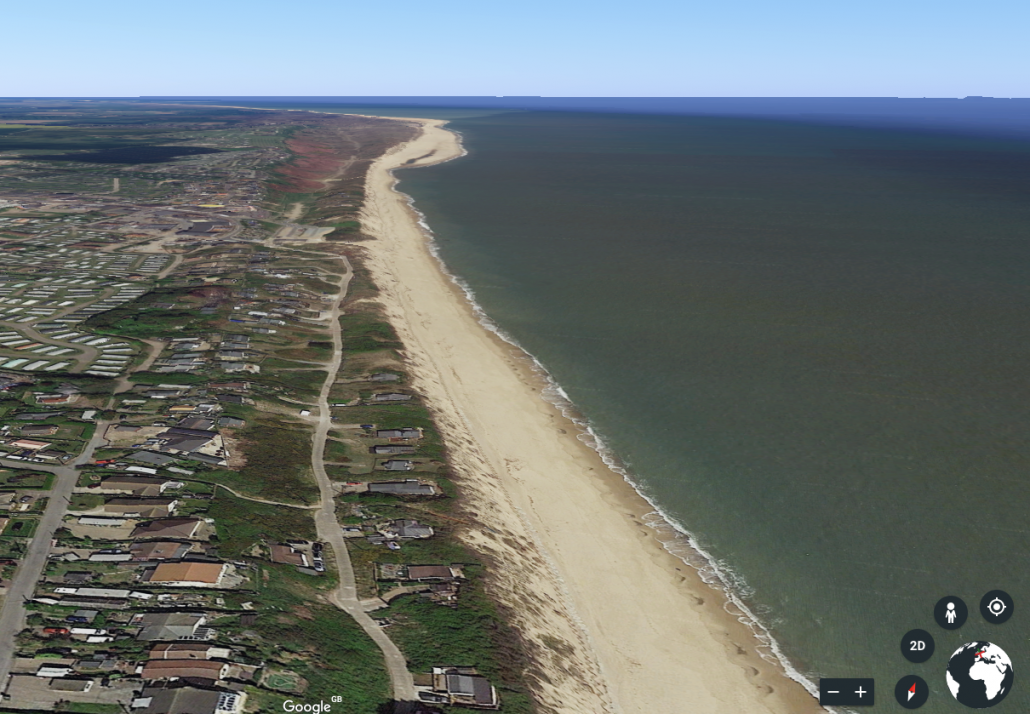
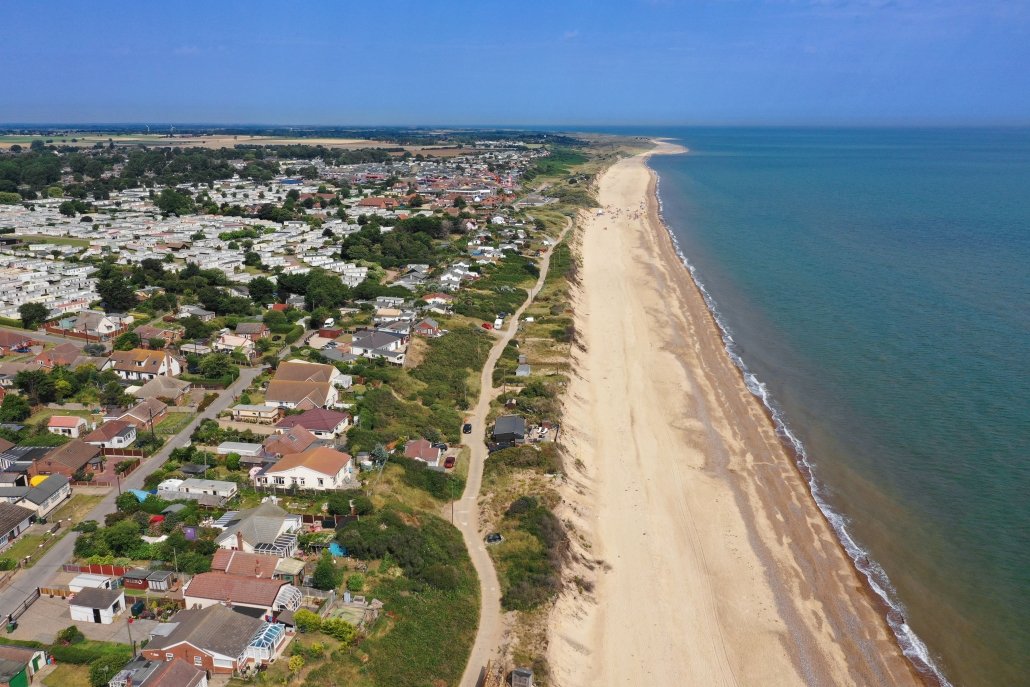
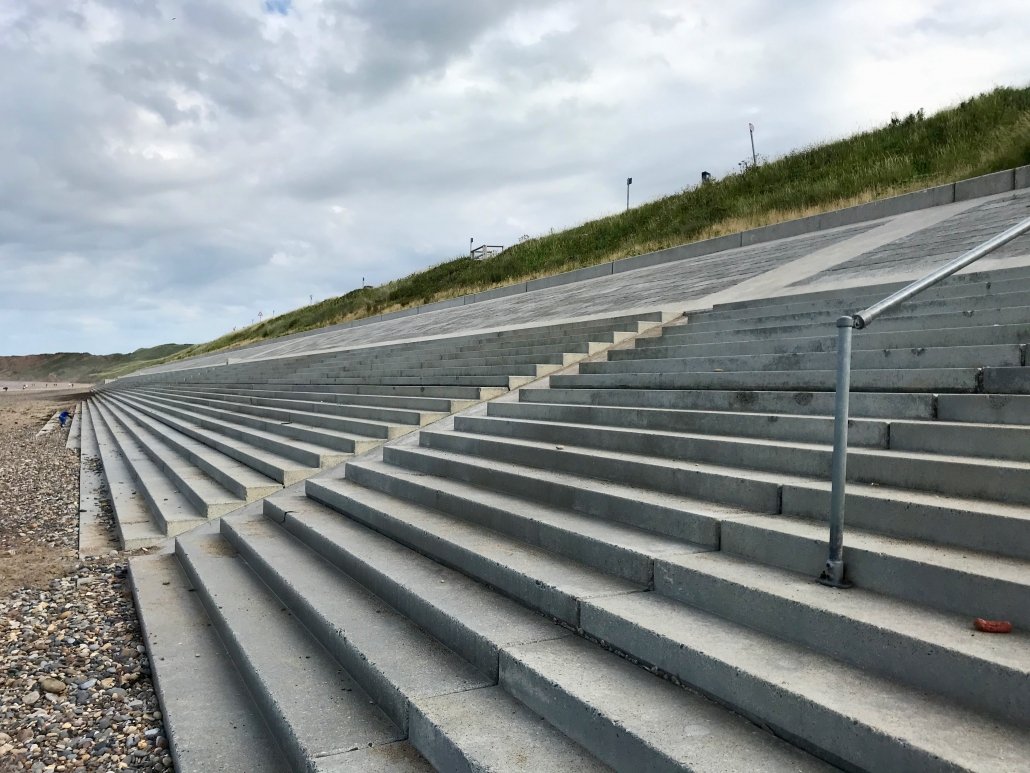
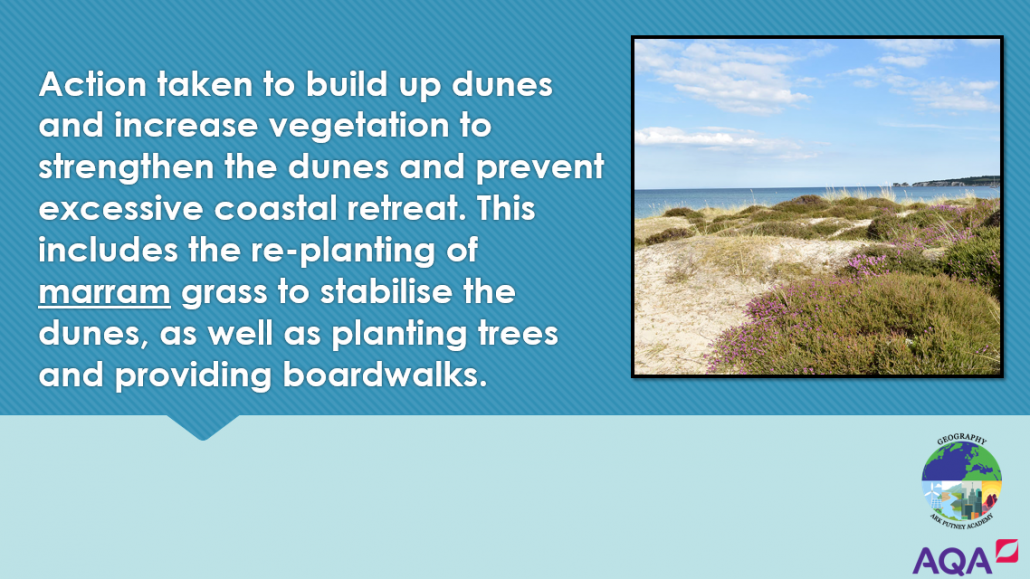
I won’t patronise you – you know this is referring to dune regeneration, one of three soft engineering strategies mentioned in the AQA GCSE specification. Hopefully, in time, your pupils will become bored of the mere sight of this image and definition as they’ll know it so well. But don’t they just know the image? Aren’t they fooling me? Have some even memorised the order and blurted it out in a concerted effort to get me to stop banging on about this and let them go to break?
No… Not if you follow it up. Great stuff, Ali, you know the definition. But I am not stopping there! Please give me a cost of using sand dune regeneration? And a benefit, please? Where was our example of this being used successfully and what was one of the benefits there? Why is sand dune regeneration significant? Who might disagree with its use? Now Ali does not just remember the image or the definition (although you’ve definitely seared that into his mind!), he remembers the rest. If this appears in the exam or if it could be used in the exam, you’ve helped to equip this pupil with the requisite knowledge of the word to be able to successfully ‘apply’ it (the key element of Assessment Objective 3). You will no doubt have got Ali to use this in a practice exam question but having used it verbally with some confidence (after several attempts, if needed – that is fine), he is slowly becoming an expert of this word. Excellent… one down, hundreds to go!
Do it often
I don’t want to launch into an analysis of the evidence behind interleaving, daily/weekly/monthly reviews or cognitive load theory (partly because it is so widespread nowadays), so I will keep this simple: It is well-known that (good) practice makes perfect, so do not use this sparingly. I see my Year 10s twice a week, so I used it twice a week – simple. It’s mostly at the end of the lesson (although, like I said I can and do mix it up) so there’s a little bit of a routine now, mostly because of my consistent use. As I said, I do not just use this – in fact, I think being too rigid will be counter-productive, bore you, bore the kids and not lead to great results. I mix it up with the Keyword of the Day and something a colleague of mine (@watts_education) introduced me to – the A to Z summariser.
What I do repeat, however, is the focus on making the pupils ‘word experts’ and ultimately more ‘word conscious’; by questioning pupils and discussing words/phrases, especially ones like ‘nutrient cycle’, ‘irrigation’ or ‘agribusiness’ which they won’t hear outside your classroom, they will eventually grow more confident. I remember one of my pupils launching into an explanation of orbital eccentricity and the Milankovitch cycle – 5 months after I’d taught it – when another had responded to a question of mine with a puzzled look. I’ll be honest; whatever you think about the quality of your teaching, the first time this vocabulary-focused approach ‘does this’ to one of your pupils, you too will wear a puzzled look.
Hopefully, this technique, along with the necessary probing questioning, which must accompany it, combined with its repeated use, will help your pupils become just a little bit more ‘word conscious’.
Abdurrahman Pérez (@mr_perez5)
August 2019
The AQA GCSE Geography keywords cards are here: https://drive.google.com/drive/folders/1PFF7PwWKl19wwsjGOSj71qtU4ZaVOhXL?usp=sharing
The AQA A-Level vocabulary is here:
https://drive.google.com/drive/folders/1oMi0u153MA2YN89vD-VghlyT4ocaCICz?usp=sharing
The keyword of the day (adapted Frayer Model): https://drive.google.com/drive/folders/16NpWw2gDtubKsBdj1BL0LFLU0fDIspCV?usp=sharing
A to Z summariser:
https://drive.google.com/drive/folders/1ywNbT5xHp2BOdkkdJE6rz2jfAtYkYAhn?usp=sharing
Internet Geography is offering a platform for guest bloggers for this academic year. Got a teaching strategy, interest or anything geographical you’d like to share? Please contact us. We’re unable to offer a financial award but we’ll send you a little treat in the post.