What is a hydrograph?
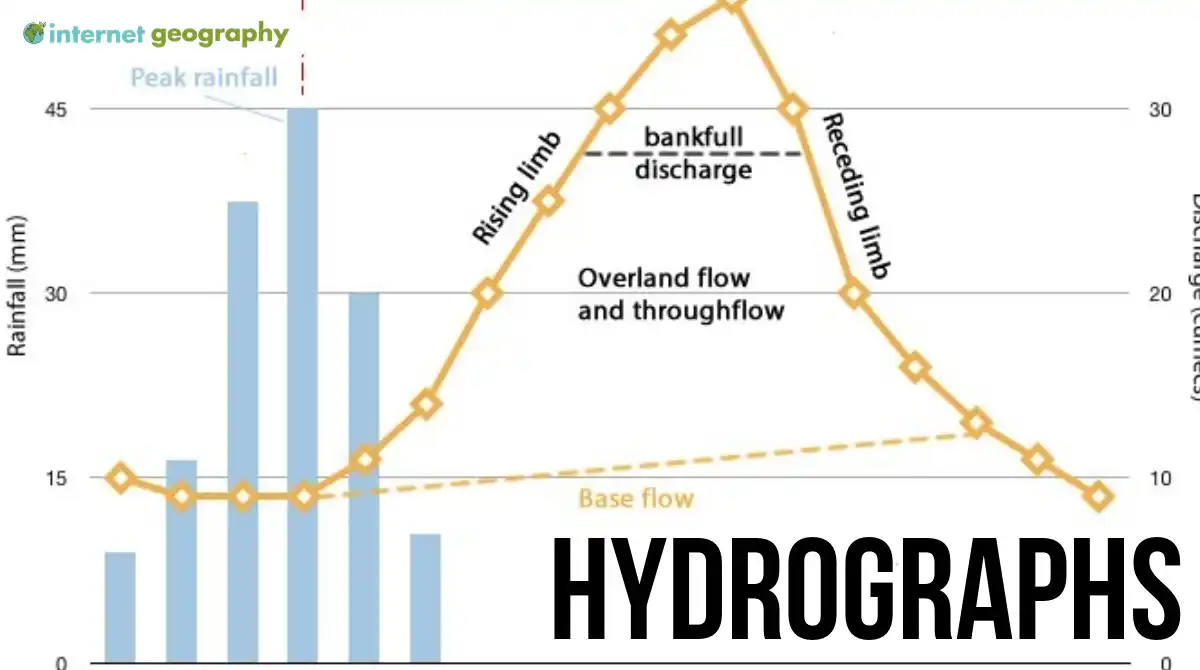
A hydrograph is a graph that shows how a river’s discharge (the volume of water flowing in the river) changes over time. Many hydrographs also show rainfall, allowing geographers to see how a river responds to a rainfall event.
Hydrographs are useful because they help explain:
- how quickly rainwater reaches a river
- how likely a river is to flood
- how physical and human factors affect river behaviour
What is a flood (storm) hydrograph?
A flood hydrograph (also known as a storm hydrograph) shows the relationship between rainfall and river discharge during and after a storm. It helps geographers understand why some rivers flood quickly while others respond more slowly.
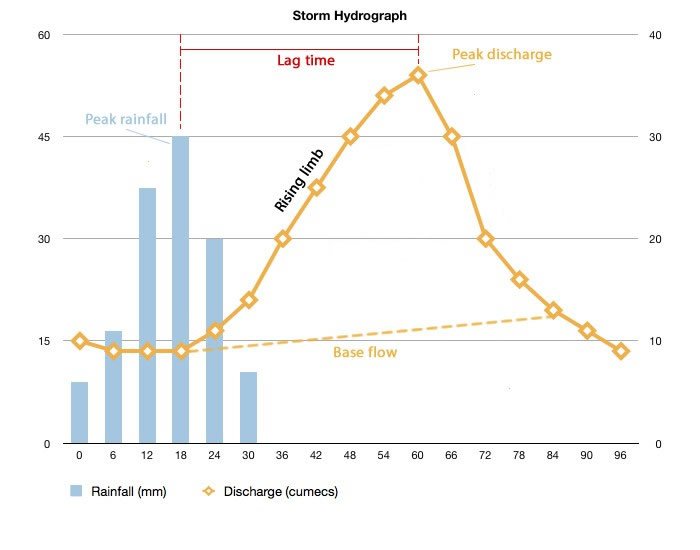
A storm hydrograph
Key features of a flood hydrograph include:
- Peak rainfall – the time when rainfall is at its highest
- Lag time – the delay between peak rainfall and peak discharge
- Peak discharge – the highest level of river discharge
- Rising limb – when river discharge is increasing
- Receding limb – when river discharge is falling
- Base flow – the normal day-to-day discharge of the river, mainly supplied by groundwater
Hydrographs can be of different shapes. The characteristics of a river, its drainage basin and the amount of water entering the system affect the shape of a flood hydrograph.
A gentle hydrograph shows the river is at low risk of flooding. These types of hydrographs have a gentle rising limb and a long lag time, meaning it takes longer for the peak rainfall to reach the river channel, so the river discharge increases slowly.
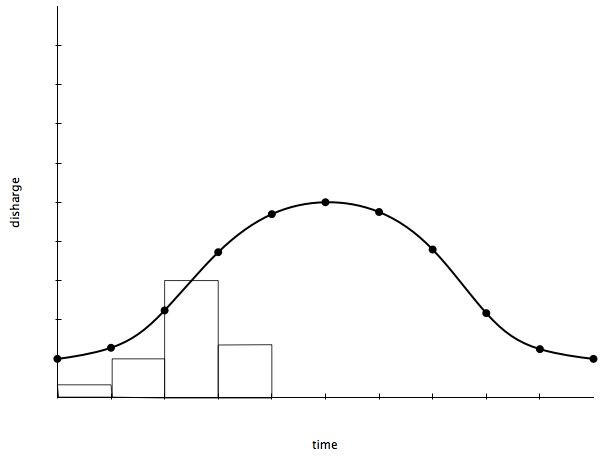
A gentle hydrograph
Flashy hydrographs have a steep rising limb and a small lag time. This indicates that river discharge increases rapidly over a short period, indicating rainwater reaches the river very quickly. This means the river is more likely to flood.
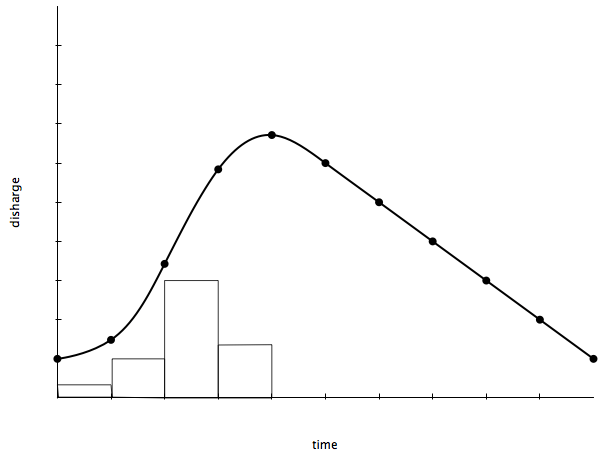
A flashy hydrograph
Rural areas with predominantly permeable rock increase infiltration and decrease surface runoff. This increases lag time. The peak discharge is also lower as it takes water longer to reach the river channel.
Physical Factors Affecting Storm Hydrographs
A range of physical factors affects the shape of a storm hydrograph. These include:
- Large drainage basins catch more precipitation and have a higher peak discharge than smaller basins. Smaller basins generally have shorter lag times because precipitation does not have as far to travel. The shape of the drainage basin also affects runoff and discharge. Drainage basins that are more circular in shape exhibit shorter lag times and higher peak discharge than long, thin basins because water has a shorter distance to travel to reach a river.
- Drainage basins with steep sides tend to have shorter lag times than shallower basins. This is because water flows faster down the steep slopes toward the river.
- Basins with many streams (high drainage density) drain more quickly and have a shorter lag time.
- If the drainage basin is already saturated, surface runoff increases due to reduced infiltration. Rainwater enters the river more quickly, reducing lag times, as surface runoff is faster than baseflow or throughflow.
- If the rock type within the river basin is impermeable, surface runoff will be higher, and throughflow and infiltration will be reduced, resulting in a shorter lag time and higher peak discharge.
- If a drainage basin has a significant amount of vegetation, it will significantly affect a storm hydrograph. Vegetation intercepts precipitation and slows the movement of water into river channels. This increases lag time. Water is also lost through evaporation and transpiration from vegetation. This reduces the river’s peak discharge.
- Precipitation amount can affect the storm hydrograph. Heavy storms increase the amount of water entering the drainage basin, leading to higher discharge. The type of precipitation can also affect the outcome. The lag time is likely greater if the precipitation is snow rather than rain. This is because snow melts before the water enters the river channel. When snow melts rapidly, the peak discharge could be high.
Human Factors Affecting Storm Hydrographs
A range of human factors affect the shape of a storm hydrograph. These include:
- Drainage systems created by humans lead to a short lag time and high peak discharge because water cannot evaporate or infiltrate into the soil.
- Areas that have been urbanised result in increased use of impermeable building materials. This means infiltration levels decrease and surface runoff increases. This leads to a short lag time and an increase in peak discharge.
Key Terms
Hydrograph – a graph that shows river discharge and rainfall over time.
Flood – when the capacity of a river to transport water is exceeded, and water flows over its banks.
Base flow – The base flow of the river represents the normal day-to-day discharge of the river and is the consequence of groundwater seeping into the river channel.
Storm flow – storm runoff resulting from storm precipitation involving surface and through flow.
Bankful discharge – the maximum discharge that a particular river channel can carry without flooding.
Peak discharge – the point on a flood hydrograph when river discharge is at its greatest.
Peak rainfall – the point on a flood hydrograph when rainfall is at its greatest.
Lag time – the period between the peak rainfall and peak discharge.
Summary
Flashcards
Coming soon
Quiz
Coming soon