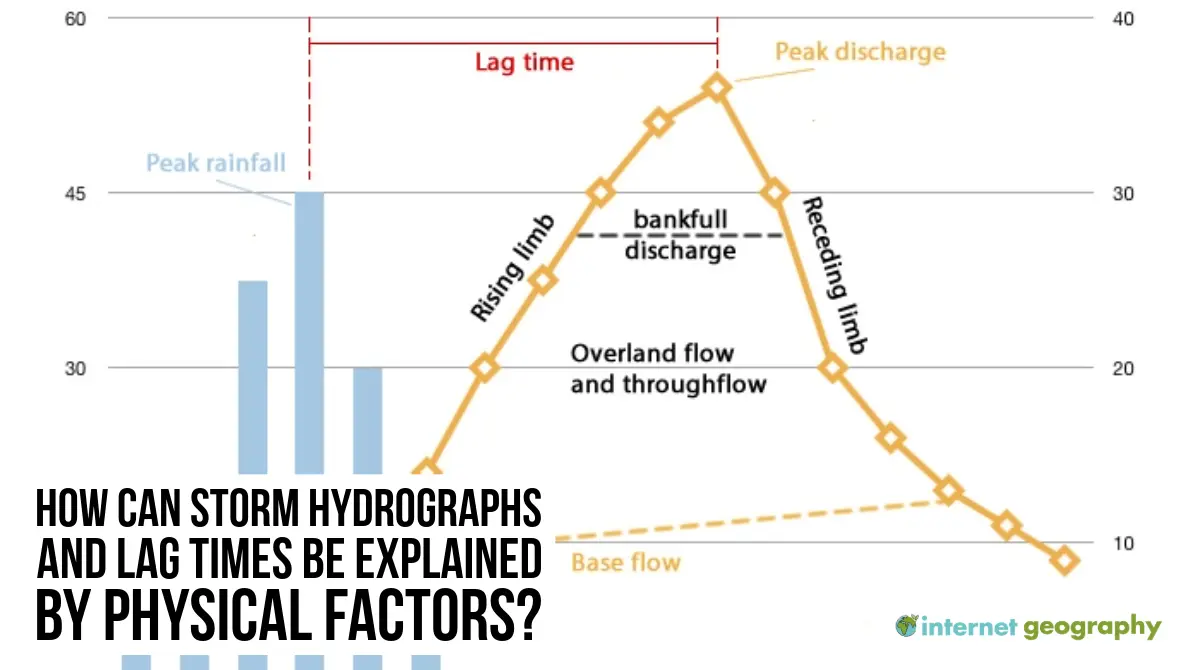
How can storm hydrographs and lag times be explained by physical factors?
Edexcel B GCSE Geography > The UK’s Evolving Physical Landscape > How can storm hydrographs and lag times be explained by physical factors?
Understanding how a river responds to a storm is essential when studying flooding. One of the key tools geographers use is a storm hydrograph, which shows how the discharge (volume of water in a river) changes over time following a period of rainfall.
A storm hydrograph is a graph that plots two things:
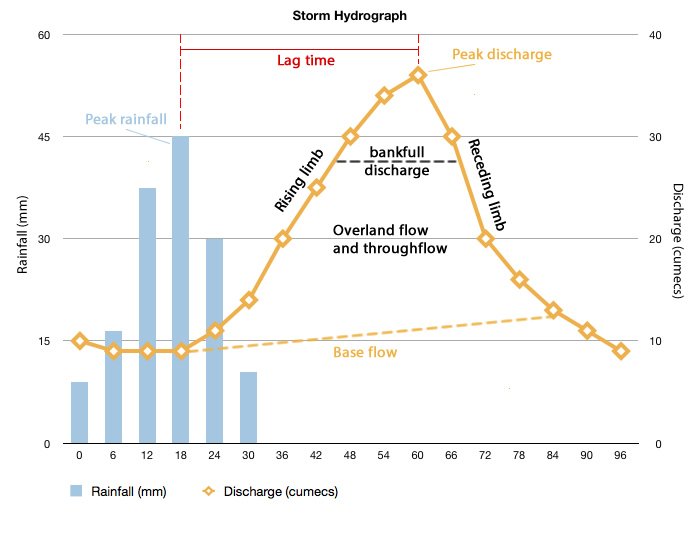
The main features of a storm hydrograph
The shape of a storm hydrograph (steep or gentle rising limb, short or long lag time) depends on a range of physical factors in the drainage basin. Let’s explore them.
Impermeable rocks (e.g. granite, slate, clay) do not allow water to infiltrate.
Permeable rocks (e.g. chalk, limestone) allow water to percolate through cracks.
Example: A river flowing over impermeable granite will respond rapidly to heavy rainfall, increasing flood risk.
Impermeable soils (e.g. clay) become quickly saturated and produce more runoff.
Permeable soils (e.g. sandy soils) absorb more rainfall, reducing surface runoff.
Steep slopes lead to rapid surface runoff as water has little time to infiltrate.
Gentle slopes allow more infiltration and slower runoff.
Upland areas (e.g. Pennines) often produce flashy hydrographs due to steep terrain and shallow soils.
Small, circular basins respond more quickly as rainfall reaches the river at the same time.
Large, elongated basins spread out the water flow.
Drainage density (how many tributaries feed the main river) also matters: higher density = faster response.
Wet ground from previous rainfall means the soil is already saturated.
Dry ground can absorb more water.
However, extremely dry, compacted soil can act like impermeable rock, increasing runoff.
A flashy storm hydrograph shows a rapid response to rainfall. It features a steep rising limb, a short lag time (the time between peak rainfall and peak discharge), and a high peak discharge. This often occurs in areas with steep slopes, impermeable rock or urban surfaces, and saturated soils, where rainfall runs quickly into the river channel, increasing flood risk.
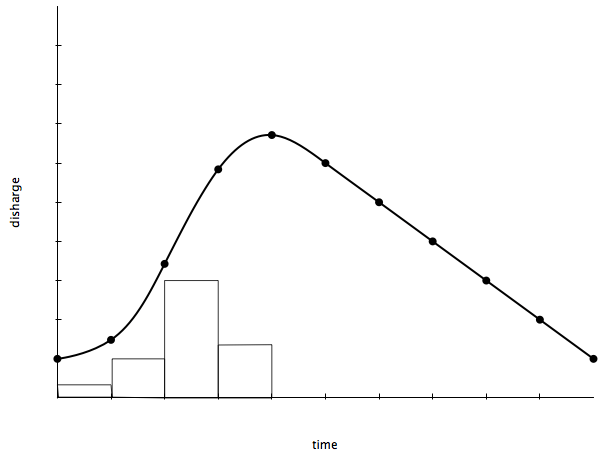
A flashy storm hydrograph
In contrast, a gentle storm hydrograph has a gradual rising limb, a longer lag time, and a lower peak discharge. This is typical of areas with gentle slopes, permeable soils or rocks, and vegetation cover, which slow down the movement of water and allow more infiltration. These conditions reduce the risk of sudden flooding and create a more stable river response to rainfall.
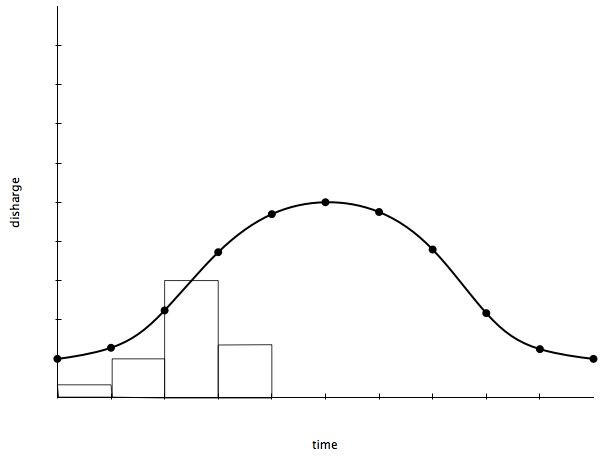
A gentle storm hydrograph
Understanding these physical factors helps predict flood risk and manage rivers. Urban planners, emergency services and flood defence teams all use this knowledge to plan ahead.