
Introduction to population
It is important to be aware of a number of key concepts and geographical terms that will be used throughout this unit. Below are some of these key geographical terms and their definitions.
Low-income countries (LICs) – Countries with a low level of economic development are known as LICs.
High-income countries (HICs) – Countries with a high level of economic development are known as HICs.
Middle-income countries (MICs) – MICs are those countries between LICs and HICs. Many of these countries are also NICs (Newly industrialised countries).
Gross national income (GNI) per capita is a common way of calculating a country’s level of development. GNI shows the average wealth of the citizens of a country. Using GNI allows comparisons to be made between countries.
In order to calculate GNI you add together the total value of all the goods and services produced by the people within the country to the income earned from investments that its businesses and people have made in other countries.
As countries have different population sizes a further calculation needs to be made in order to make comparisons fair. This involves dividing the GNI by the population of the country to arrive at the GNI per capita. Then the value is converted into US dollars to allow comparisons to be made between countries. Finally, each figure must be adjusted based on its income. In low-income countries (LICs) goods and services often cost less than in high-income countries (HICs).
The threshold for each classification of development is set by the World Bank and changes over time. In 2019 the thresholds were:
- LIC – GNI per capita less than or equal to $1,025
- HIC – GNI per capita of $12,376+
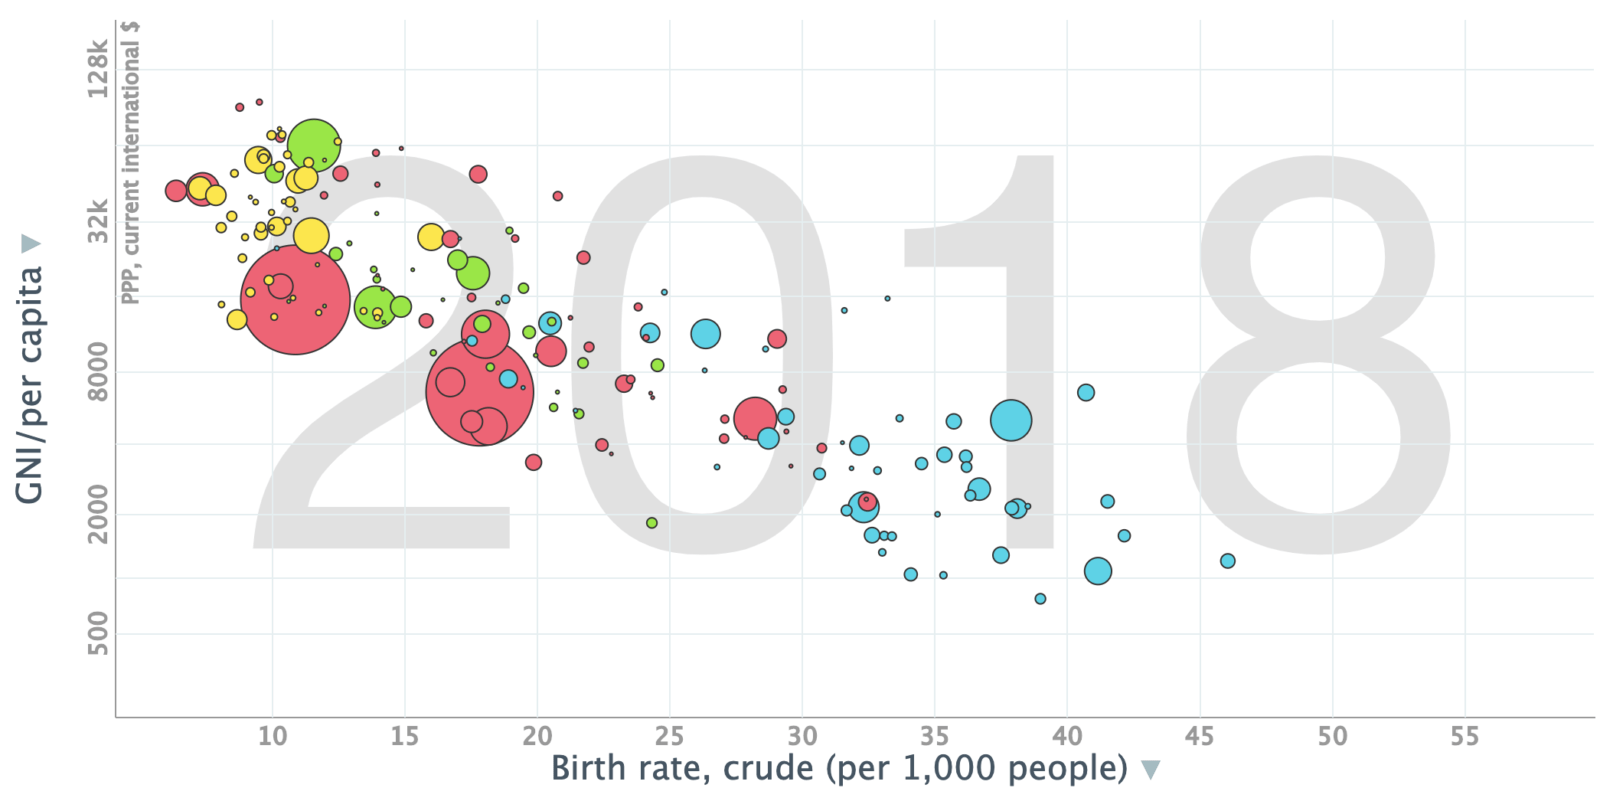
Economic development has a significant influence on many characteristics of a country. For example, as a country becomes more developed, its GNI increases, and this has a significant impact on its demographics (population). The graph below shows GNI per capita for countries around the world against the crude birth rate. Click the image to view the changes over time which clearly illustrate the drop in crude birth rate as GNI per capita increases.


Related Topics
Use the images below to explore related GeoTopics.