Skills Plus Baseline 1 Statistical Skills
If you are here, it’s probably because you need to work on some of the statistical skills covered in Skills Plus Baseline 1.
Study the information below (you might find it helpful to make notes or revision cards) and attempt the interactive activities to help improve your geographical skills.
Mean
The mean, also known as the average, is considered the most helpful measure of central tendency and requires a simple calculation. All values are added together and then divided by the number of values.
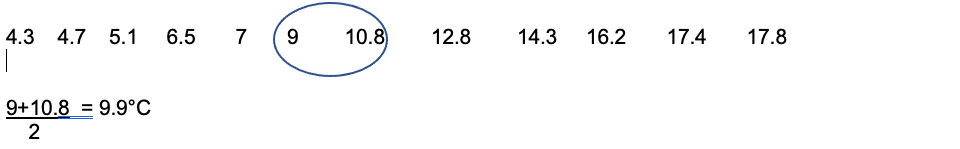
You were given data for average temperatures in Manchester, as shown below.

To calculate the mean:

The answer is 10.49°C, which should then be rounded up to 10.5°C.
Don’t forget to include the units (°C in this case) in your answer. Lots of students forget this in the exam, so they lose marks.
Activity
The table below shows the life expectancy at birth in 2020 for the four countries that make up the UK. Calculate the mean life expectancy for both males and females across the four countries to 1 decimal point. Include your working out.
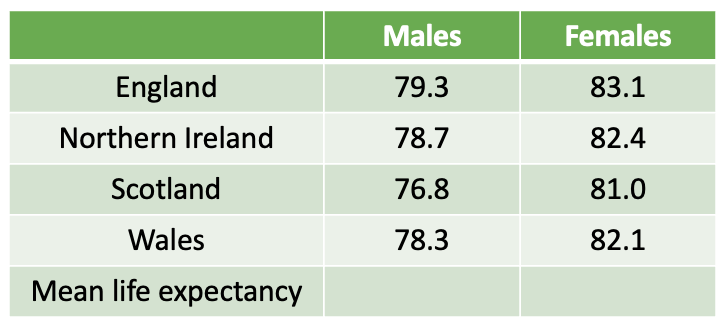
Males
79.3 + 78.7 + 76.8 + 78.3 / 4 = 78.3
Females
83.1 + 82.4 + 81.0 + 82.1 / 4 = 82.2
Median
When all figures are placed in rank order (lowest to highest), the median is the middle value. If there are an even number of figures the middle two are selected, and the average is calculated.
For the Manchester data, this is how we calculate the median:
Don’t forget to include the units (°C in this case) in your answer. Lots of students forget this in the exam, so they lose marks.
Activity
Below are the sizes of pebbles measured at a beach. Identify the median pebble size.
3.4 cm
11 cm
4.5 cm
6 cm
2.1 cm
4.2 cm
20 cm
8.3 cm
13 cm
The correct answer is 6 cm.
2.1cm | 3.4 cm | 4.2 cm | 4.5 cm | 6 cm | 8.3 cm | 11 cm | 13 cm | 20 cm
Range
The range of a data set is the difference between the highest and lowest values.
To calculate the range, we must identify the highest and lowest values in the Manchester data.
Highest value = 17.8°C
Lowest value = 4.3°C
Annual average temperature range = 17.8°C – 4.3°C = 13.5°C
Remember to include the unit of measure in your answer (°C).
Activity
Below are the sizes of pebbles measured at a beach. Calculate the range in pebble sizes.
3.4 cm
11 cm
4.5 cm
6 cm
2.1 cm
4.2 cm
20 cm
8.3 cm
13 cm
Calculation:
Largest value – smallest value = range
20 cm – 2.1 cm = 17.9 cm
The correct answer is 17.9 cm
Mode
Ok, we were a bit naughty with this question on Skills Plus Baseline 1. There was no mode in the data set.
The mode is the most frequent value in a data set. An example is shown below.
The table below shows the velocity of a river at ten different locations. Identify the mode.
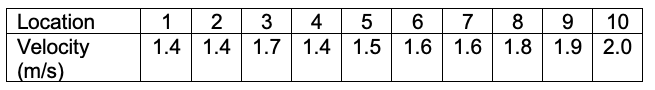
The mode is 1.4 m/s. This is because 1.4 m/s is the most common value in the data set, as it appears three times.
Activity
Below are the sizes of pebbles measured at a beach. Calculate the mode.
3.4 cm
11 cm
4.5 cm
6 cm
2.1 cm
4.5 cm
20 cm
8.3 cm
13 cm
The correct answer is 4.5 cm because it is the most common value in the data set.
Percentage Change
Calculating percentage change is an essential skill for geographers to have. When geographers collect data over time, the results may increase. Calculating a percentage increase allows geographers to see how much their data has changed.
Calculating the percentage increase between two figures is achieved by:
- Calculate the difference between the two numbers
- Divide the increase (difference) by the first number
- Multiply the answer by 100.
In this example, we will examine changes in the GDP of the UK. In 2001, the UK had a total economic output of £1.3 trillion. In 2015, it was £1.64 trillion.
Therefore, 1.64 – 1.3 = 0.34 divided by 1.3 × 100 = 26.2%. The UK’s total economic output between 2001 and 2015 had a percentage increase of 26.2%.
Activity
The data below shows the number of animals counted in a small woodland ecosystem in 2010 and then again in 2020.
Calculate the percentage increase in the number of each species, then drag and drop the correct answer in the table.