Tag Archive for: geography case study

Sandsend Coastal Protection Scheme – What is the unintended consequence?

In 2016 hard engineering defences were constructed between Whitby and Sandsend. Concrete steps, replacing damaged defences, now protect the 800m section of the coast.
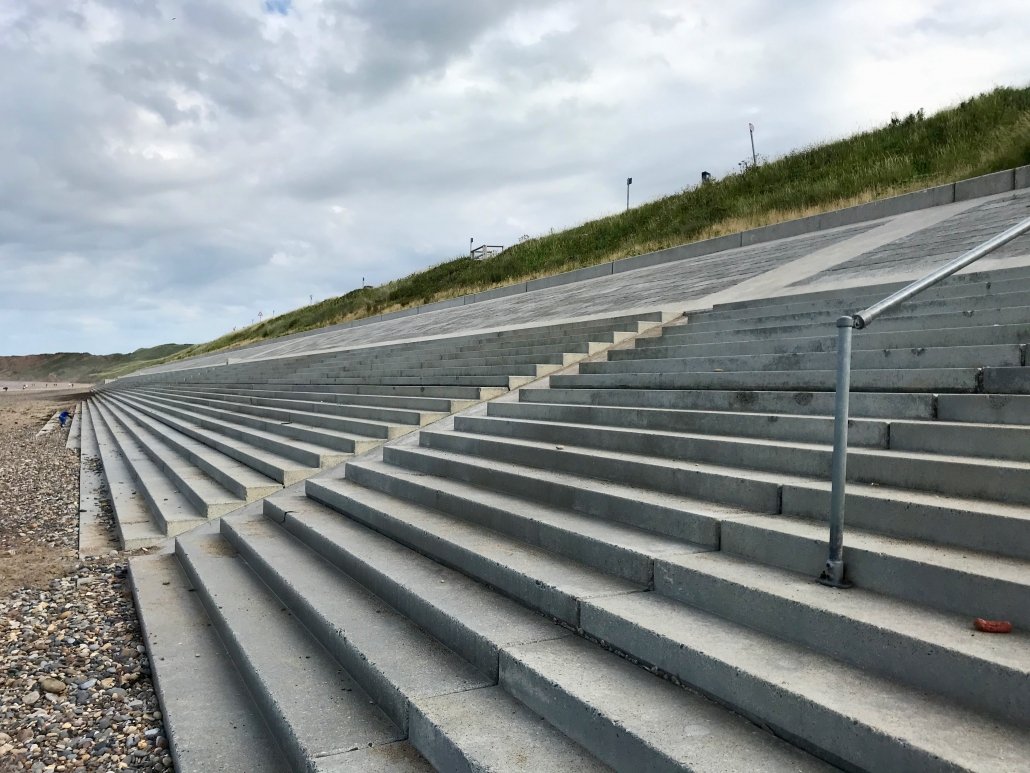
Concrete steps at Sandsend

Concrete steps at Sandsend

The defences have been designed to protect the A174 Sandsend Road between Whitby and Sansend. Soft engineering solutions, such as the stabilisation of the boulder clay cliffs have also been introduced. The new coastal defences protect the main road from closure. The image below shows the newly reprofiled cliffs with vegetation to secure the cliff.
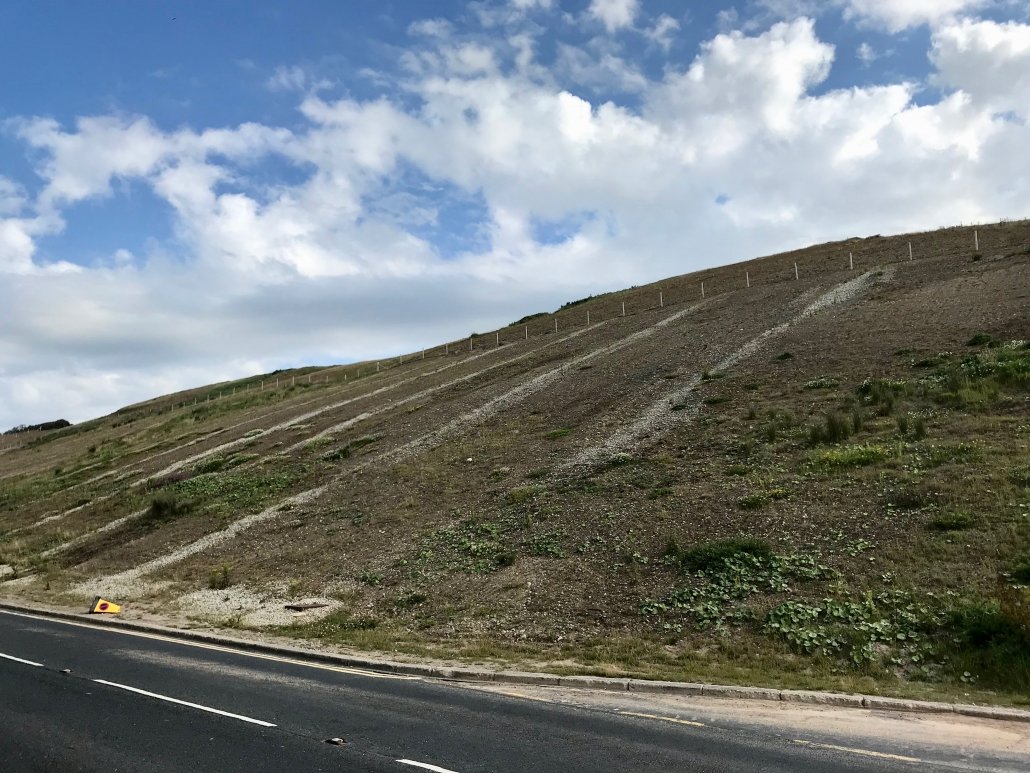
Sandsend cliff stabilisation

Sandsend cliff stabilisation behind the A174

The £9 million project is a partnership development between The Environment Agency and North Yorkshire County Council. The defences avoid regular road closures previously caused by boulder clay landslips in winter and during periods of bad weather.

Work on the lower sections of the new scheme involved building 450 steps using an innovative system that carried concrete along a rail built into the defences.  The concrete mix was strengthened by mixing 5mm plastic filaments.

However, subsequent poor weather and strong winds have caused erosion to the sea wall exposing the plastics. Estimates suggest that this is happening over 75% of the structure. Erosion is evident at the bottom of the structure, which is continuously in contact with the sea and beach. As a result of this, plastic filaments are now standard on the beach.
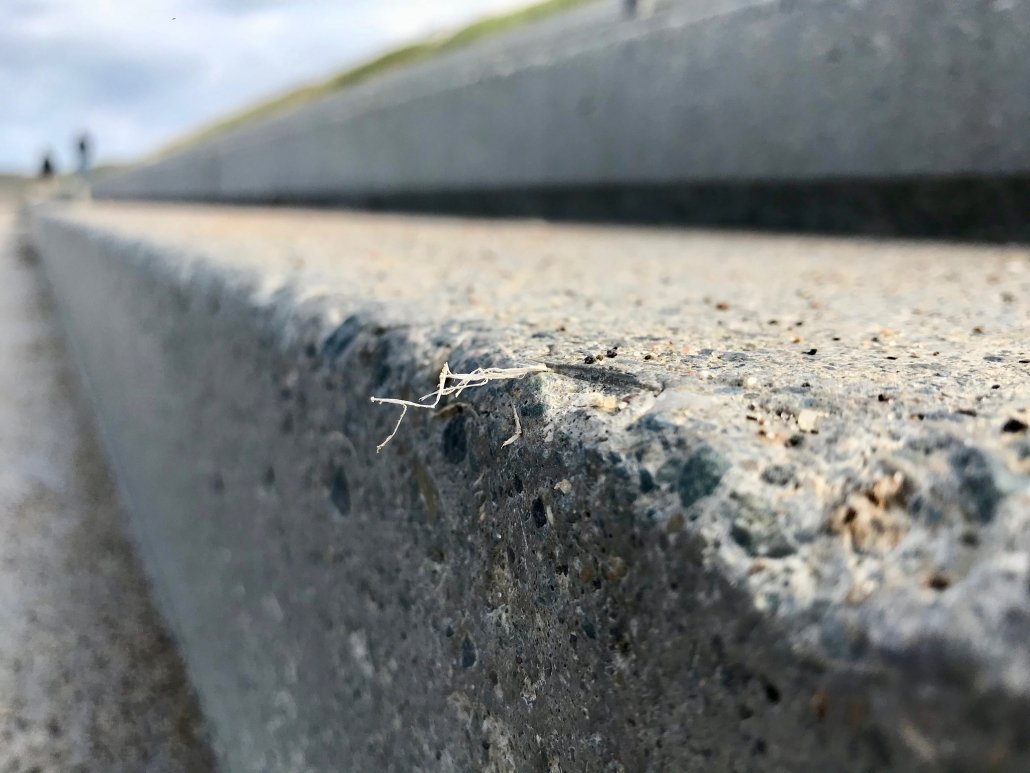
Plastic filaments at Sandsend

Plastic filaments at Sandsend

Critics of the scheme are campaigning to avoid the use of similar construction techniques in the future.

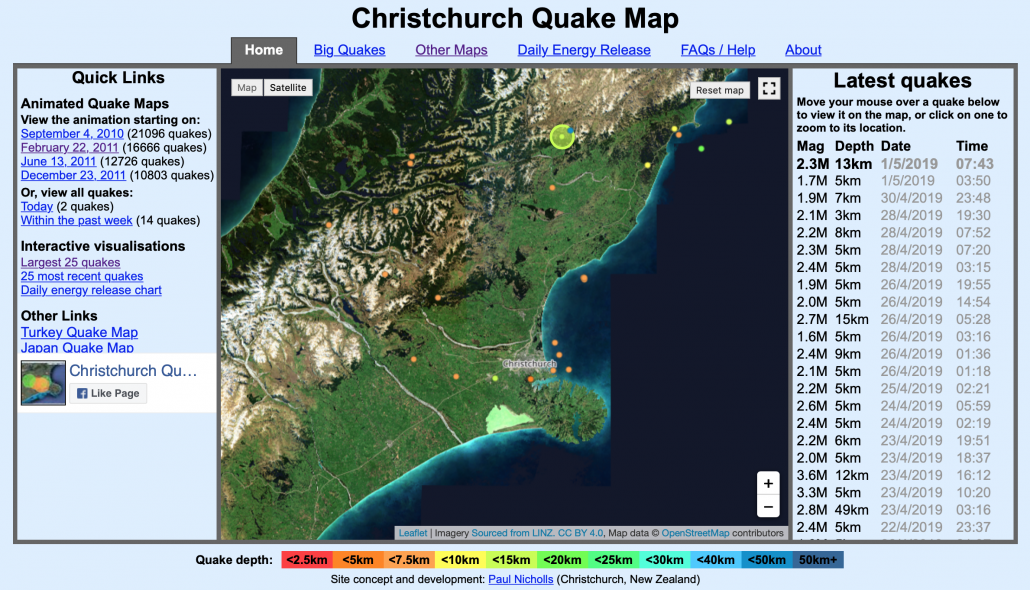


Christchurch Earthquake Animated Map

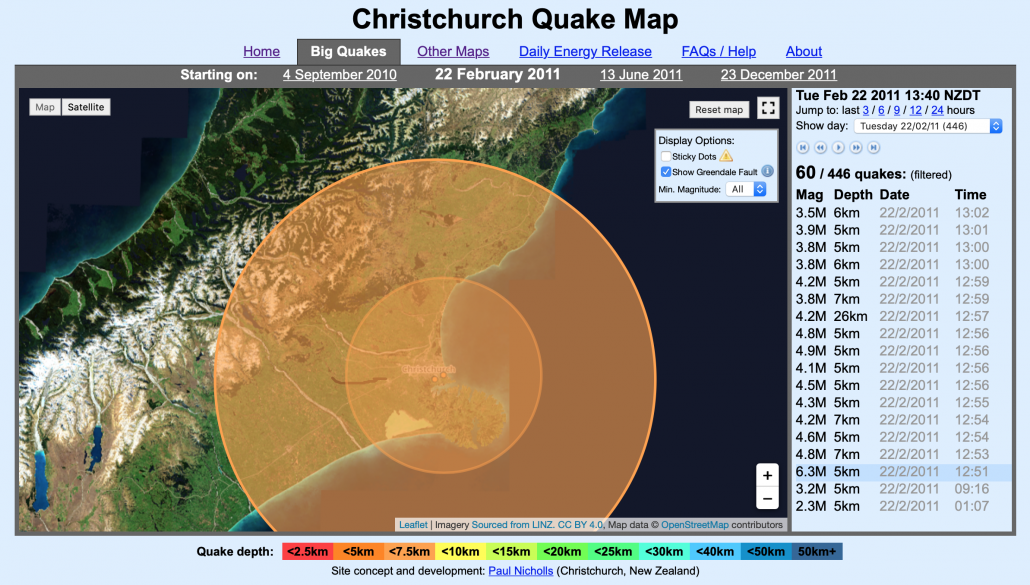
Christchurch earthquake map is a fantastic resource for illustrating the swarm of earthquakes that occurred on February 22nd 2011, when 185 people were killed as the result of a magnitude 6.3 quake.

To access the resources head over to the Christchurch earthquake map

Christchurch Earthquake Animated Map

Christchurch Earthquake Animated Map

Next, click February 22, 2011 under quick links (on the left of the page). The animation will start automatically. The magnitude and depth of the earthquakes are illustrated using coloured proportional circles.

2011 Christchurch Earthquake Map

2011 Christchurch Earthquake Map

You can speed up and slow down the animation using the media controls to the top right of the page.

We’ve recently added Christchurch earthquake case study resources on Internet Geography.

Slumping at Hornsea March 2019 – One week on

Slumping at Hornsea March 2019

Slumping at Hornsea March 2019

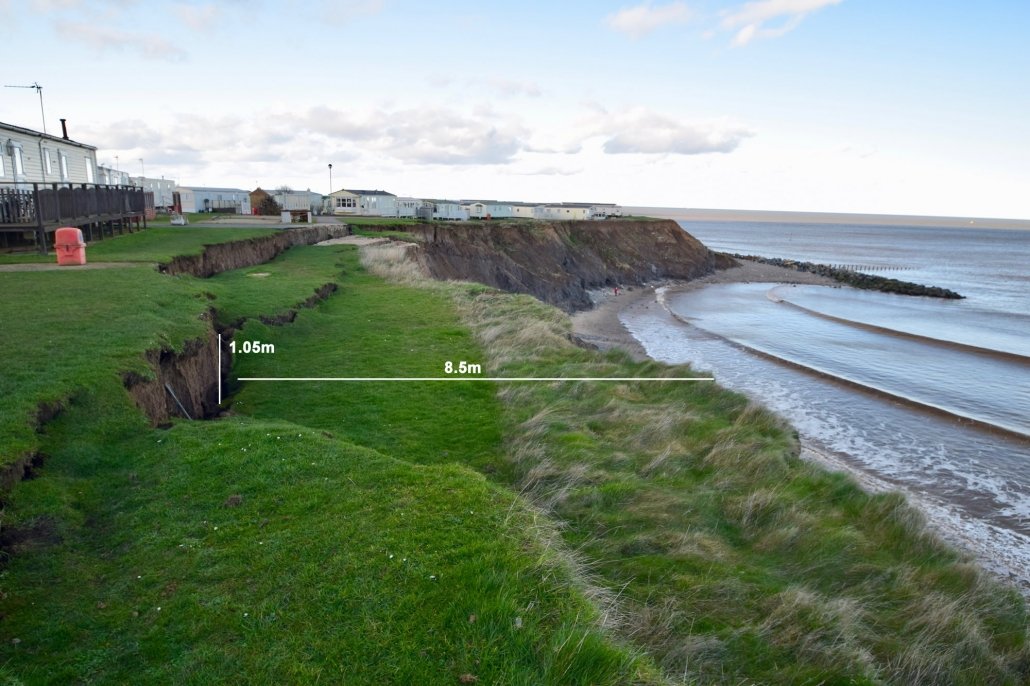
Following a spell of unusually hot and dry weather in February significant mass movement has occurred at Hornsea on the Holderness Coast. On Friday 8th March 2019 the Hull Daily Mail first reported a crack forming in the cliffs at Longbeach Leisure Park to the south of Hornsea. A large section of the cliff, around 50m long and 8.5m at its widest point, had slumped. The image* below shows the area affected by slumping on Saturday 9th March 2019.

Slumping at Long Beach Leisure Park

Slumping at Long Beach Leisure Park


Slumping to the south of sea defences at Hornsea is common, however, this is one of the largest sections of boulder clay cliff to have slumped since 2008 when 8.75m of land was lost. A number of holiday homes will be relocated away from the affected area taking the total number this year to 12.


Coastal erosion at Hornsea


To the south of the sea defences, the rate of erosion increases rapidly. The red line on the map below shows the location of the cliff top on Saturday 9th March 2019. By zooming in you can really appreciate the rate of erosion since the satellite photograph was taken on 1st July 2018. As you can see a considerable amount of land has been lost since the satellite image was taken.

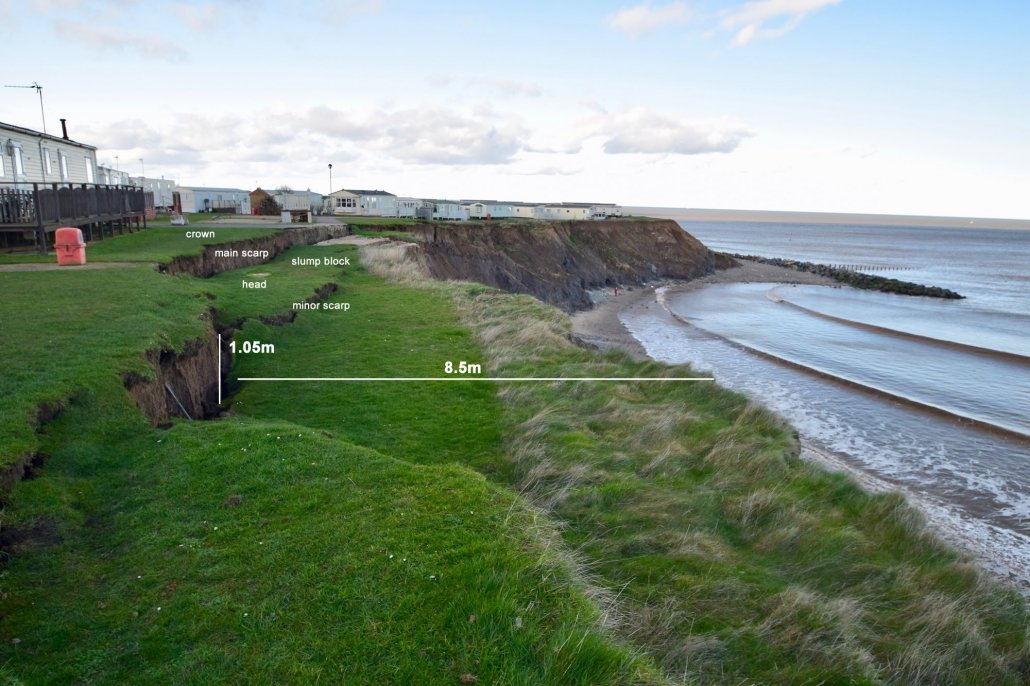
The slump at Hornsea illustrates the classic features of this type of mass movement as shown in the image* below.

Classic features of slumping

Classic features of slumping

Hornsea Slump Gallery*

This slideshow requires JavaScript.

* All images are © Internet Geography. You are welcome to use them in the classroom. They should not be redistributed, shared or included in any resource distributed on the internet, whether paid or free, without the written permission of Internet Geography.

Geography Case Study