Climate can be displayed on a graph. A climate graph contains two pieces of information, the amount of rainfall and the temperature of an area. The temperature is shown as a line, and rain is displayed as bars. The figures are usually calculated as an average over a number of years. This reduces the impact of any anomalies in the weather affecting the statistics. Rainfall and temperature are usually represented on the same set of axes with the months of the year along the base.
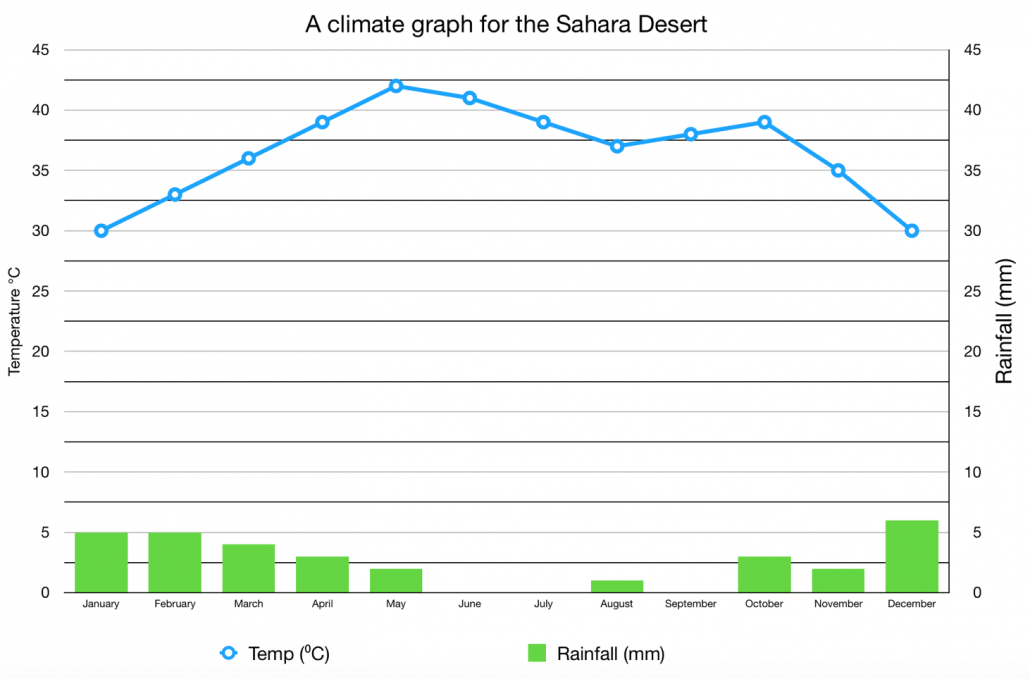
A climate graph for the Sahara Desert
Interpreting and describing climate graphs
Look at the overall shape of the graph. Does the temperature change throughout the year or look almost flat? Is the line gentle or steep?
Does rainfall change throughout the year, or does it remain stable?
Look for extremes – identify the lowest and highest rainfall and temperature and the month when it occurs. Make sure you include units, e.g. Celsius or millimetres.
Are there any anomalies (different, abnormal, peculiar) in the data?
Can you identify seasonal patterns in temperature and rainfall?
Calculate the temperature/rainfall range by subtracting the lowest figure from the highest.
Calculate the total annual rainfall by adding the monthly totals together.
Related Topics
Use the images below to explore related GeoTopics.