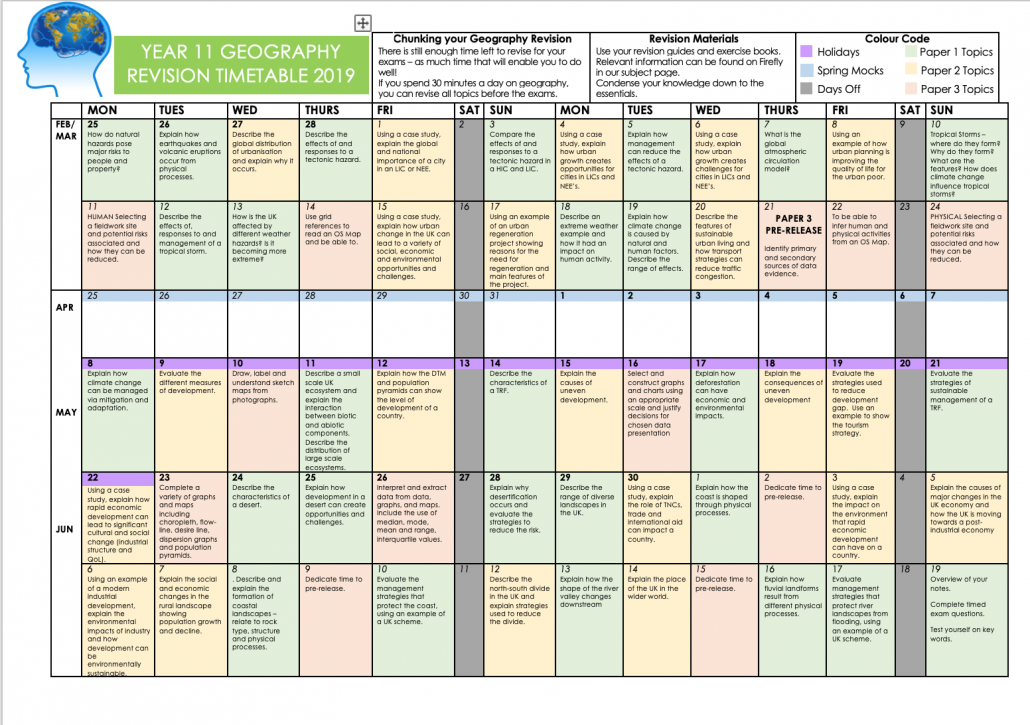
Looking for an AQA GCSE Geography revision timetable? Laura Gregson (@grego_geog) has produced this fantastic example inspired by @MrThorntonTeach. Click the image or here to download.
Geography Revision Timetable 2019
Be sure to thank Laura on Twitter, it’s a great piece of work!
If you have created a similar revision timetable and you’re happy to share please send a copy to [email protected]
Internet Geography has developed a series of guided Geography in the News homework activities that encourage wider reading around current affairs in geography. However, if you are looking for a more open-ended activity consider downloading our Geography in the News research template. The template encourages students to review the sources of information they find using the CRAAP analysis and provides support in identifying synoptic links.
https://www.internetgeography.net/wp-content/uploads/2019/02/Geography-in-the-news-2.jpg6701200Anthony Bennetthttps://www.internetgeography.net/wp-content/uploads/2024/01/Internet-Geography-Logo.pngAnthony Bennett2019-02-24 18:23:032019-09-10 16:49:37Geography in the News Research and Evaluation
Geography in the News has been created to encourage students to read more widely, examining synoptic links and keep up to date with geography-related news. It has been developed to be given to students as homework and includes differentiated activities for them to complete. Our downloadable homework comes in an editable format so you can make adjustments appropriate to your students. We’ll be publishing a new homework relating to a recent event in the news every week during term time.
A peer/self-assessment sheet will soon be made available to download so students can peer/self assess their homework to help reduce your workload. You can access past mark schemes by signing up to a free subscription to Internet Geography.
Our seventh homework is based on an article on the ITV news website examining the rubbish dump exposed by coastal erosion at Lynemouth beach, Northumberland. View the article.
If you like Geography in the News 7 please consider subscribing to Internet Geography Homework Plus. This is a new development on Internet Geography. Every week we publish homework to support skills development at GCSE. Homeworks will include the opportunity to practise and develop map skills, exam technique and statistical skills. So far we’ve covered a range of skills including:
exam technique
4/6 figure grid references
sketches from photographs
height on a map
longitude and latitude
mean, median & mode
range & interquartile range
gradient, contour & spot height
the direction a photo has been taken in
pie charts
bar graphs & histograms
line & compound graphs
Homework Plus also comes with a mark scheme that can be used by teachers or students for peer/self assessment.
In addition to Homework Plus resources, you also have access to our weekly GEOGREVISE. Each week we publish resources based on a unit from the AQA GCSE Geography course. Every GEOGREVISE pack includes:
A four-step guide to revision
A personal learning checklist (PLC) for a GCSE Geography unit
10 strategies for revision
95 retrieval practice questions for a GCSE Geography unit
Answers to all retrieval practice questions
An overview of retrieval practice for parents and copies of the questions to support parents in engaging with revision
This resource is ideal for class-based revision, intervention, homework and engaging parents in revision.
Subscription for Homework Plus, including GEOGREVISE starts at only £20 per year for an individual class teacher. Also available are department level subscriptions for schools. Find out which subscription is right for you. By subscribing you’ll have instant access to all the documents published so far.
By downloading the document you agree not to edit the document header and footer before issuing to students. You also agree not to redistribute the document on a public forum e.g. TES, Schoolology or similar. You are welcome to share with students on services such as Show My Homework, however, do not make the document available to other users.
Seen a useful article for our next Geography in the News? Please let us know using the form below.
https://www.internetgeography.net/wp-content/uploads/2019/02/Geography-in-the-news-7.jpg6701200Anthony Bennetthttps://www.internetgeography.net/wp-content/uploads/2024/01/Internet-Geography-Logo.pngAnthony Bennett2019-02-24 15:01:482019-02-24 15:13:59Geography in the News 7
Geography in the News has been created to encourage students to read more widely, examining synoptic links and keep up to date with geography-related news. It has been developed to be given to students as homework and includes differentiated activities for them to complete. Our downloadable homework comes in an editable format so you can make adjustments appropriate to your students. We’ll be publishing a new homework relating to a recent event in the news every week during term time.
A peer/self-assessment sheet will soon be made available to download so students can peer/self assess their homework to help reduce your workload. You can access past mark schemes by signing up to a free subscription to Internet Geography.
Our sixth homework is based on an article on the BBC website examining new life on one of the world’s newest islands. View the article.
If you like Geography in the News 6 please consider subscribing to Internet Geography Homework Plus. This is a new development on Internet Geography. Every week we publish homework to support skills development at GCSE. Homeworks will include the opportunity to practise and develop map skills, exam technique and statistical skills. So far we’ve covered a range of skills including:
exam technique
4/6 figure grid references
sketches from photographs
height on a map
longitude and lattitude
mean, median & mode
range & interquartile range
gradient, contour & spot height
the direction a photo has been taken in
pie charts
bar graphs & histograms
line & compound graphs
Homework Plus also comes with a mark scheme that can be used by teachers or students for peer/self assessment.
In addition to Homework Plus resources, you also have access to our weekly GEOGREVISE. Each week we publish resources based on a unit from the AQA GCSE Geography course. Every GEOGREVISE pack includes:
A four-step guide to revision
A personal learning checklist (PLC) for a GCSE Geography unit
10 strategies for revision
95 retrieval practice questions for a GCSE Geography unit
Answers to all retrieval practice questions
An overview of retrieval practice for parents and copies of the questions to support parents in engaging with revision
This resource is ideal for class-based revision, intervention, homework and engaging parents in revision.
Subscription for Homework Plus, including GEOGREVISE starts at only £2 per month for an individual class teacher (that’s just 50p a week for a quality homework and mark scheme!) or save £4 with an annual subscription for £20. Also available are department level subscriptions for schools. Find out which subscription is right for you. By subscribing you’ll have instant access to all the documents published so far.
By downloading the document you agree not to edit the document header and footer before issuing to students. You also agree not to redistribute the document on a public forum e.g. TES, Schoolology or similar. You are welcome to share with students on services such as Show My Homework, however, do not make the document available to other users.
Seen a useful article for our next Geography in the News? Please let us know using the form below.
https://www.internetgeography.net/wp-content/uploads/2019/02/Geography-in-the-news-6.jpg6701200Anthony Bennetthttps://www.internetgeography.net/wp-content/uploads/2024/01/Internet-Geography-Logo.pngAnthony Bennett2019-02-08 14:41:212019-02-24 15:06:47Geography in the News 6
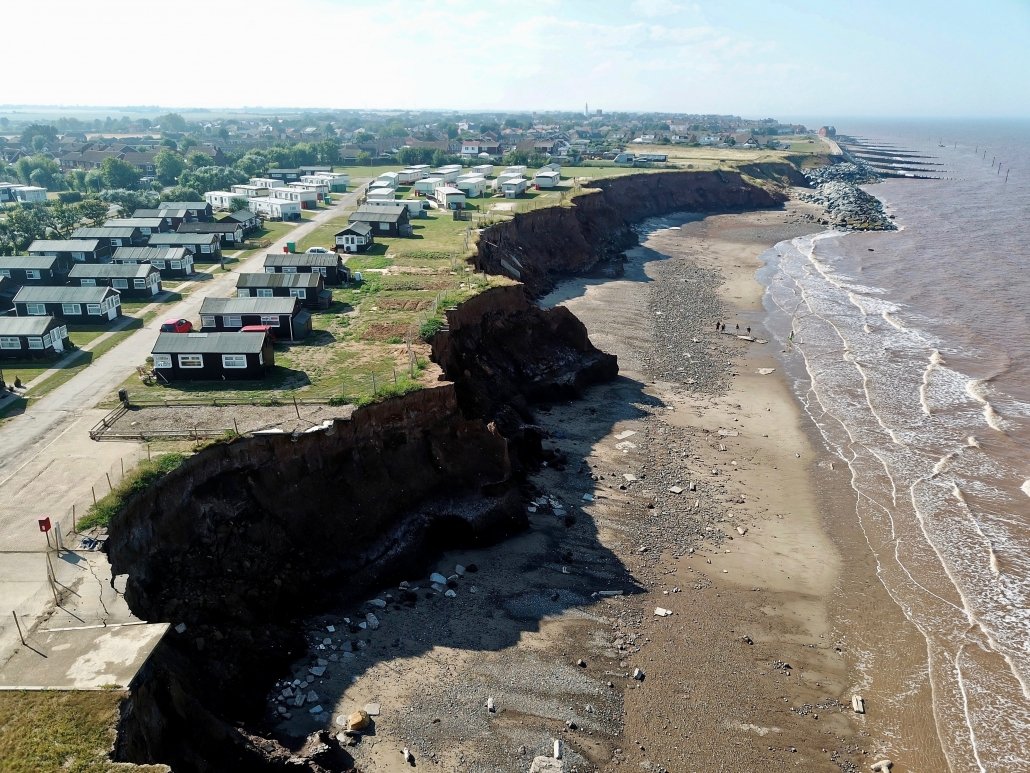
Using Google Images and Google Maps you can easily create a map using an album of geotagged photos. Geotagged photos are those that include data on the location they were taken. Most modern mobile phones have this feature as do some digital cameras. If you are not sure a quick search on the Internet will tell you if this option is available and how to enable it.
Below is a map showing the location of a number of images taken in and around Hornsea on the Holderness Coast using an iPhone and a drone.
Looks complicated? Don’t worry, it’s not! Just follow the steps below.
To begin with, you will need to upload your geotagged photos to a new album in Google Photos. To do this login to your Google account and go to https://photos.google.com. Next create a new album by clicking +Create in the top right corner, then select Album.
Give the folder a title then upload the images you want to map.
Next, go to https://www.google.com/maps/d/ and select +Create New Map (top left corner). Your new map will open and be called Untitled map. Give your image a suitable title by clicking untitled map in the top left window.
Rename your map.
Click Save.
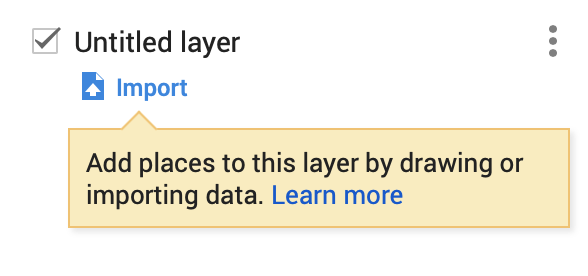
Next click Import (under the first layer which is called Untitled layer).
Click Import
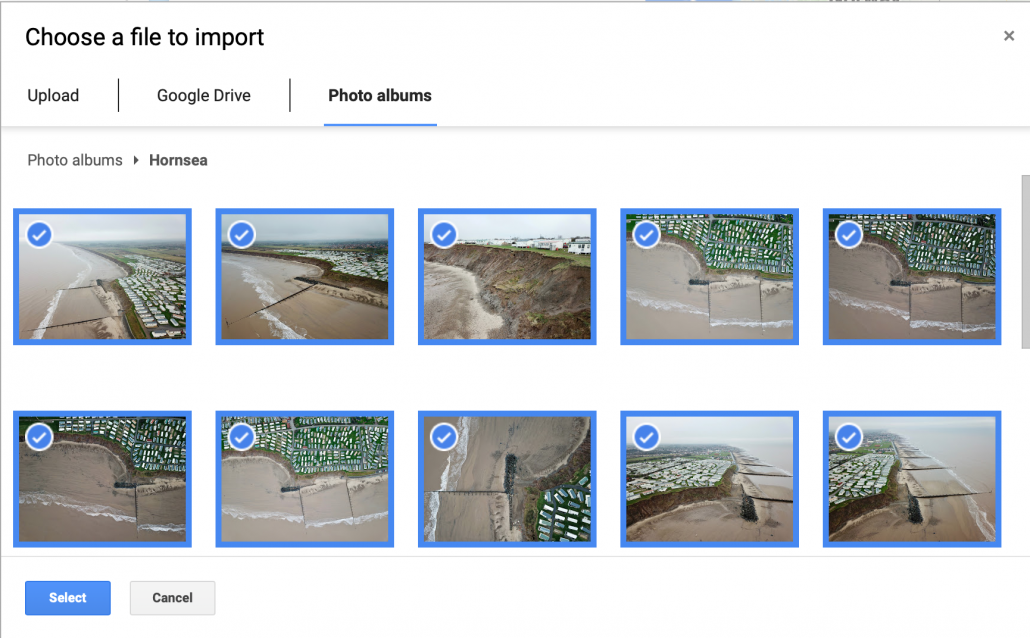
Click the Photo albums tab. Next, locate the album where your photos are stored. Select all the images you want to import onto the map.
Select images you want to import
Next, click Select. The photos will then be copied onto your map.
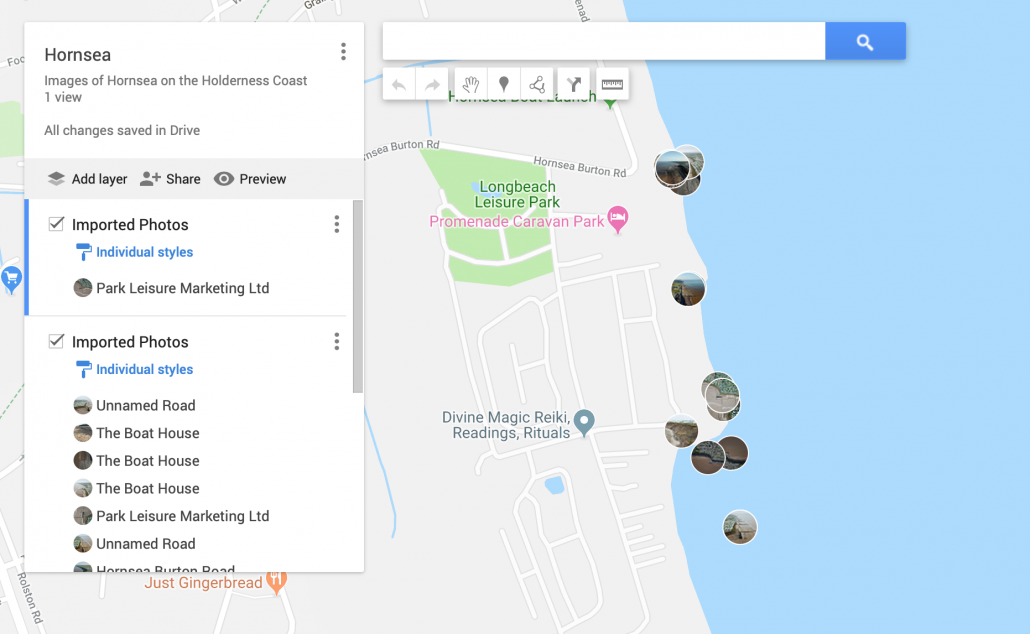
This will create at least one layer containing your images and an icon of each image will be displayed on the map.
Imported images and new layers
You will notice that each photograph has been given a title based on the location it was taken. You should go through these and rename them as appropriate. Once you’ve finished you can share your map with others by clicking Share > Change > On. You can then share the URL. You can also embed the map on a website by clicking the three dots next to the map title. Then select Embed on My Site.
https://www.internetgeography.net/wp-content/uploads/2019/02/Imported-images.png9851600Anthony Bennetthttps://www.internetgeography.net/wp-content/uploads/2024/01/Internet-Geography-Logo.pngAnthony Bennett2019-02-01 18:41:022019-02-01 18:41:03Map your photos using Google Maps
Geography in the News has been created to encourage students to read more widely, examining synoptic links and keep up to date with geography-related news. It has been developed to be given to students as homework and includes differentiated activities for them to complete. Our downloadable homework comes in an editable format so you can make adjustments appropriate to your students. We’ll be publishing a new homework relating to a recent event in the news every week during term time.
A peer/self-assessment sheet will soon be made available to download so students can peer/self assess their homework to help reduce your workload. You can access past mark schemes by signing up to a free subscription to Internet Geography.
Our fifth homework is based on an article on the Guardian website examining the polar vortext currently affecting the USA. View the article.
if you like Geography in the News 5 please consider subscribing to Internet Geography Homework Plus. This is a new development on Internet Geography. Every week we publish homework to support skills development at GCSE. Homeworks will include the opportunity to practise and develop map skills, exam technique and statistical skills. So far we’ve covered a range of skills including:
exam technique
4/6 figure grid references
height on a map
mean, median & mode
range & interquartile range
gradient, contour & spot height
the direction a photo has been taken in
pie charts
bar graphs & histograms
line & compound graphs
Homework Plus also comes with a mark scheme that can be used by teachers or students for peer/self assessment. Subscription starts at only £2 per month for an individual class teacher (that’s just 50p a week for a quality homework and mark scheme!) or save £4 with an annual subscription for £20. Also available are department level subscriptions for schools. Find out which subscription is right for you. By subscribing you’ll have instant access to all the documents published so far.
By downloading the document you agree not to edit the document header and footer before issuing to students. You also agree not to redistribute the document on a public forum e.g. TES, Schoolology or similar. You are welcome to share with students on services such as Show My Homework, however, do not make the document available to other users.
Seen a useful article for our next Geography in the News? Please let us know using the form below.
https://www.internetgeography.net/wp-content/uploads/2019/02/Geography-in-the-News-5.jpg6701200Anthony Bennetthttps://www.internetgeography.net/wp-content/uploads/2024/01/Internet-Geography-Logo.pngAnthony Bennett2019-02-01 16:33:342019-02-24 15:08:06Geography in the News 5
Geography in the News has been created to encourage students to read more widely, examining synoptic links and keep up to date with geography-related news. It has been developed to be given to students as homework and includes differentiated activities for them to complete. Our downloadable homework comes in an editable format so you can make adjustments appropriate to your students. We’ll be publishing a new homework relating to a recent event in the news every week during term time.
A peer/self-assessment sheet will soon be made available to download so students can peer/self assess their homework to help reduce your workload. You can access past mark schemes by signing up to a free subscription to Internet Geography.
Our fourth homework is based on an article on the BBC website examining Iceland’s pledge to stop selling own-brand palm products.. View the article.
if you like Geography in the News 3 please consider subscribing to Internet Geography Homework Plus. This is a new development on Internet Geography. Every week we publish homework to support skills development at GCSE. Homeworks will include the opportunity to practise and develop map skills, exam technique and statistical skills. So far we’ve covered a range of skills including:
exam technique
4/6 figure grid references
height on a map
mean, median & mode
range & interquartile range
gradient, contour & spot height
the direction a photo has been taken in
pie charts
bar graphs & histograms
line & compound graphs
Subscription starts at only £2 per month for an individual class teacher (that’s just 50p a week for a quality homework and mark scheme!) or save £4 with an annual subscription for £20. Also available are department level subscriptions for schools. Find out which subscription is right for you. By subscribing you’ll have instant access to all documents published so far.
By downloading the document you agree not to edit the document header and footer before issuing to students. You also agree not to redistribute the document on a public forum e.g. TES, Schoolology or similar. You are welcome to share with students on services such as Show My Homework, however, do not make the document available to other users.
Seen a useful article for our next Geography in the News? Please let us know using the form below.
https://www.internetgeography.net/wp-content/uploads/2019/01/Geography-in-the-news-4.jpg6701200Anthony Bennetthttps://www.internetgeography.net/wp-content/uploads/2024/01/Internet-Geography-Logo.pngAnthony Bennett2019-01-26 19:52:342019-01-26 20:36:45Geography in the News 4
Google My Maps is a great way of collating and displaying case studies in one place. Below is an example that includes some of the case studies on Internet Geography.
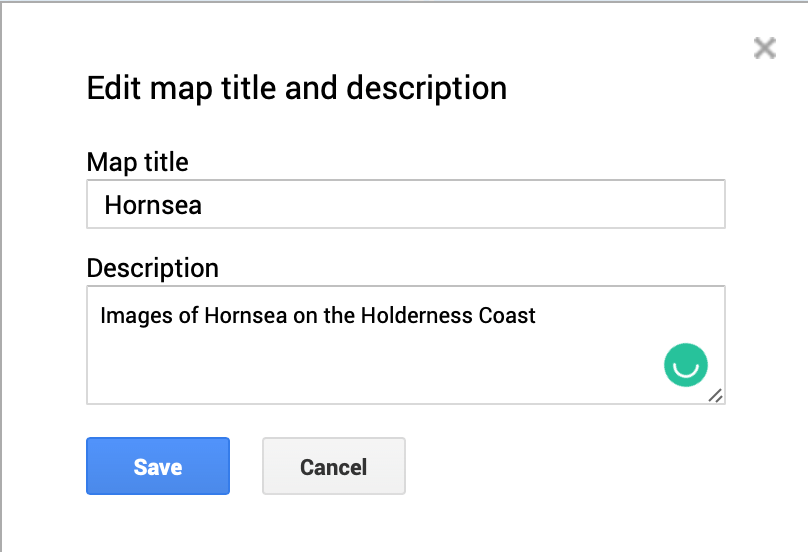
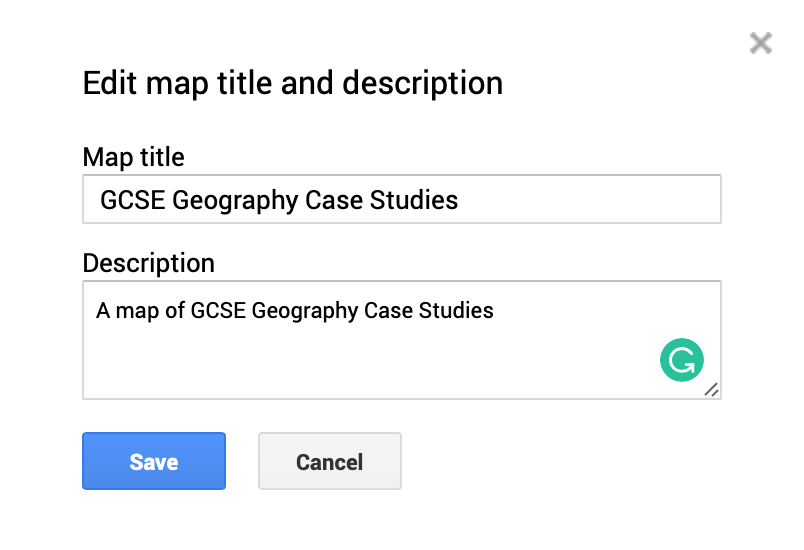
To get started on your map log into your Google account then head over to Google My Maps. Click New Map and give it a suitable title and description.
Edit map title and description
In this map, we are going to create a series of layers. This is so that we can group case studies by themes. By doing this we can filter case studies by type and display them on a base map.
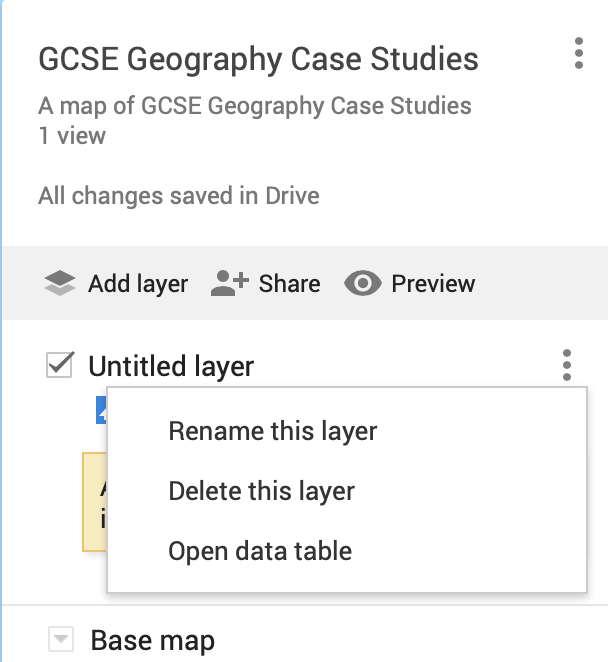
Rename the Untitled layer that has been automatically created. In this case, we will name it Natural Disasters. To do this click the icon showing 3 dots and select Rename This Layer.
Rename Layer
Give your layer an appropriate name.
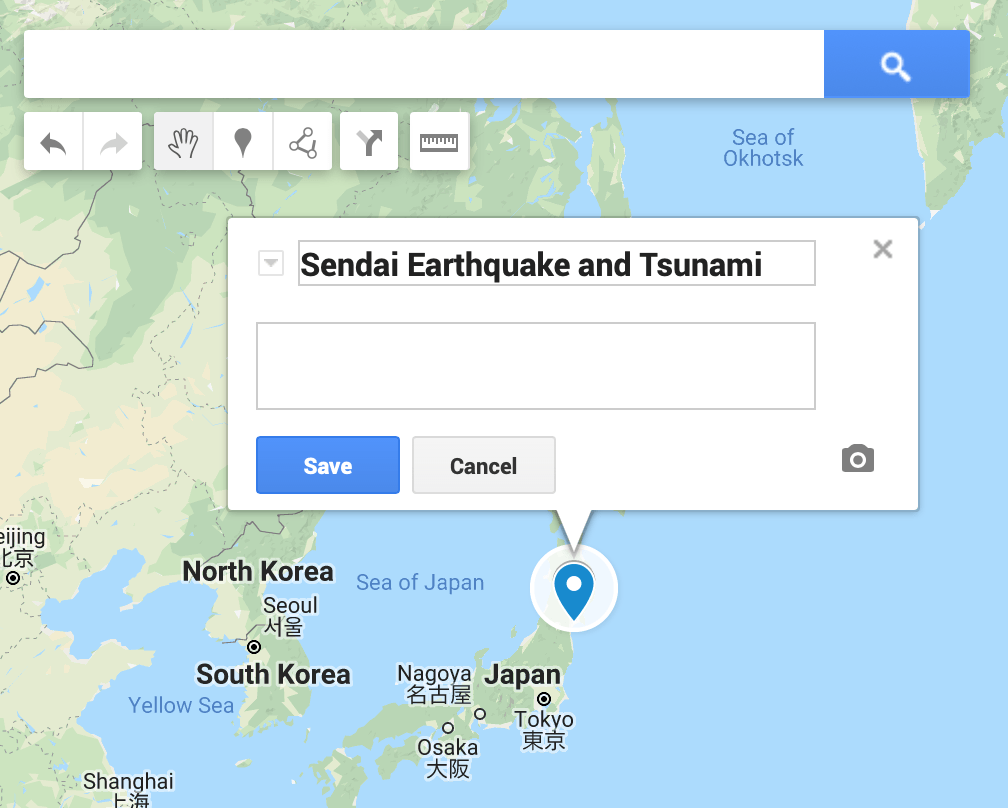
You are next going to add a marker to show the location of a natural disaster. In this case, we will add the Sendai earthquake and tsunami in Japan. To get started, locate the place where the natural hazard occurred. Then click the marker icon (it looks like an upside down droplet) then click the location where you want to place it. You can then rename the marker as shown below.
Adding a marker
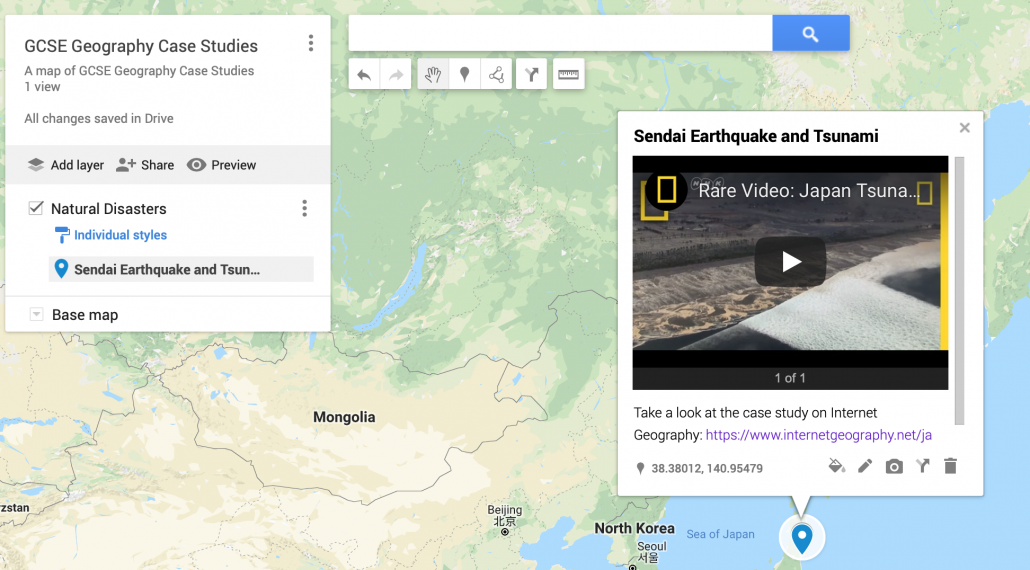
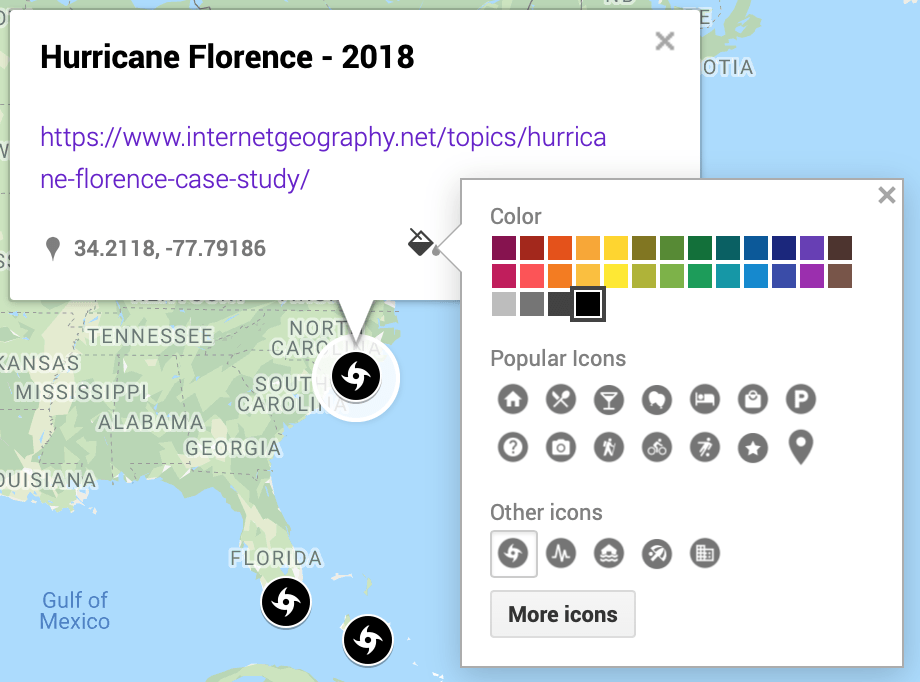
Next, you can add images and videos (such as those on YouTube) to the marker. You can also include hyperlinks to web pages that could be used for revision. Below is an example of a marker with a Youtube video embedded and a hyperlink to a case study on Internet Geography.
Marker with embedded YouTube video and hyperlink
You now need to repeat this for all the case studies you want to include in this layer.
You can then create another layer and repeat the process. You can edit the colour and style of markers by theme. This will help differentiate the different markers. To do this click the bucket and select a colour of your choice, then click more icons to choose an appropriate icon.
Edit marker style
You can filter your map by turning layers off to show the location of a particular category of case study. To do this de-select the tick next to the layer name.
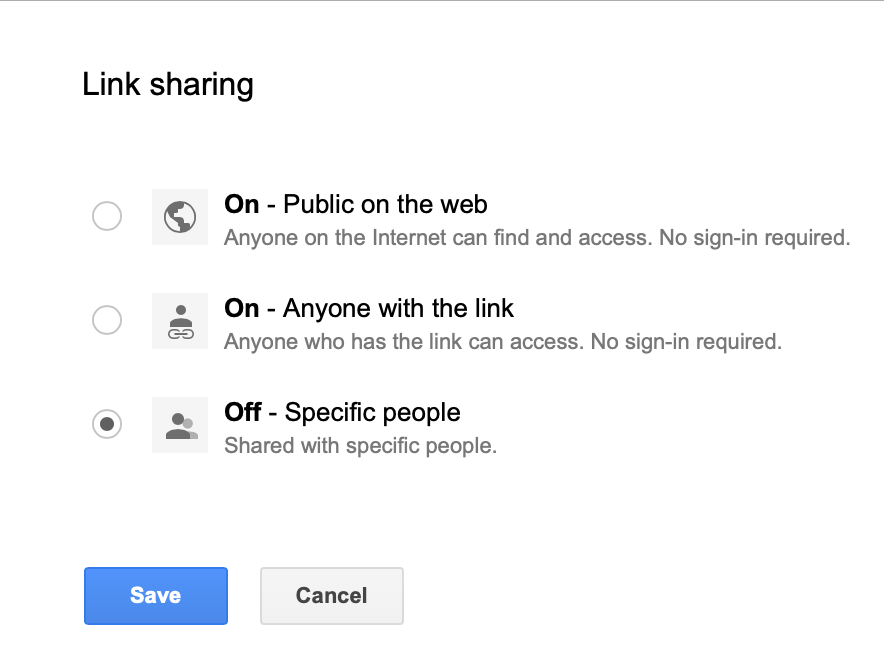
Once your map is finished you can share it by clicking the Share icon. Then click Change. Select an appropriate option. Once you’ve done this copy the link and share.
https://www.internetgeography.net/wp-content/uploads/2019/01/Case-Study-Map-in-Google-My-Maps.png9851600Anthony Bennetthttps://www.internetgeography.net/wp-content/uploads/2024/01/Internet-Geography-Logo.pngAnthony Bennett2019-01-23 07:20:492019-01-23 10:31:49Creating a case study map in Google My Maps
Geography in the News has been created to encourage students to read more widely, examining synoptic links and keep up to date with geography-related news. It has been developed to be given to students as homework and includes differentiated activities for them to complete. Our downloadable homework comes in an editable format so you can make adjustments appropriate to your students. We’ll be publishing a new homework relating to a recent event in the news every week during term time.
A peer/self-assessment sheet will soon be made available to download so students can peer/self assess their homework to help reduce your workload. You can access past mark schemes by signing up to a free subscription to Internet Geography.
Our third homework is based on an article on the BBC website examining the the role of Nuclear Power in climate change. View the article.
if you like Geography in the News 3 please consider subscribing to Internet Geography Homework Plus. This is a new development on Internet Geography. Every week we publish homework to support skills development at GCSE. Homeworks will include the opportunity to practise and develop map skills, exam technique and statistical skills. Subscription starts at only £2 per month for an individual class teacher (that’s just 50p a week for a quality homework and mark scheme!) or save £4 with an annual subscription for £20. Also available are department level subscriptions for schools. Find out which subscription is right for you.
By downloading the document you agree not to edit the document header and footer before issuing to students. You also agree not to redistribute the document on a public forum e.g. TES, Schoolology or similar. You are welcome to share with students on services such as Show My Homework, however, do not make the document available to other users.
Seen a useful article for our next Geography in the News? Please let us know using the form below.
https://www.internetgeography.net/wp-content/uploads/2019/01/Geography-in-the-news-3.jpg6701200Anthony Bennetthttps://www.internetgeography.net/wp-content/uploads/2024/01/Internet-Geography-Logo.pngAnthony Bennett2019-01-20 13:28:432019-01-26 19:52:10Geography in the News – 3
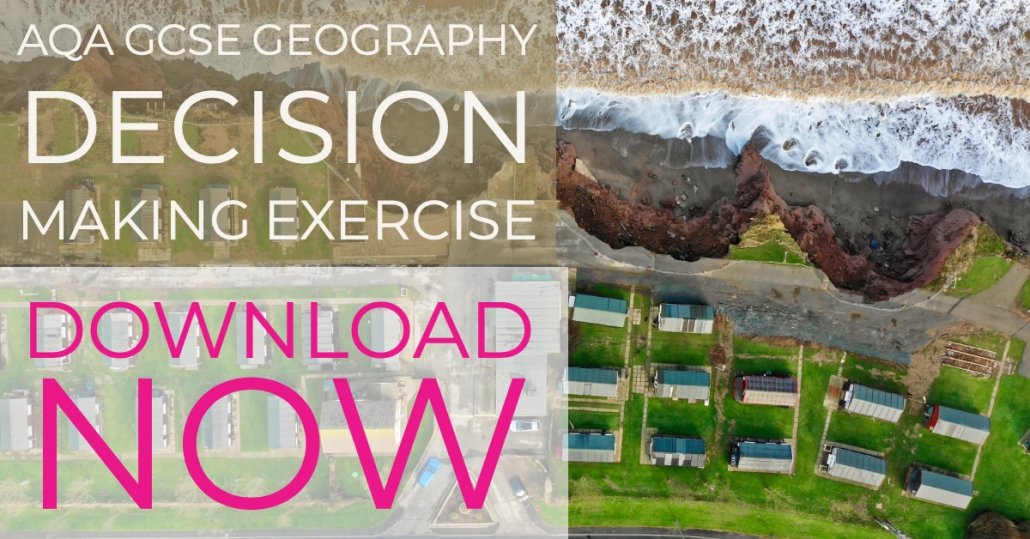
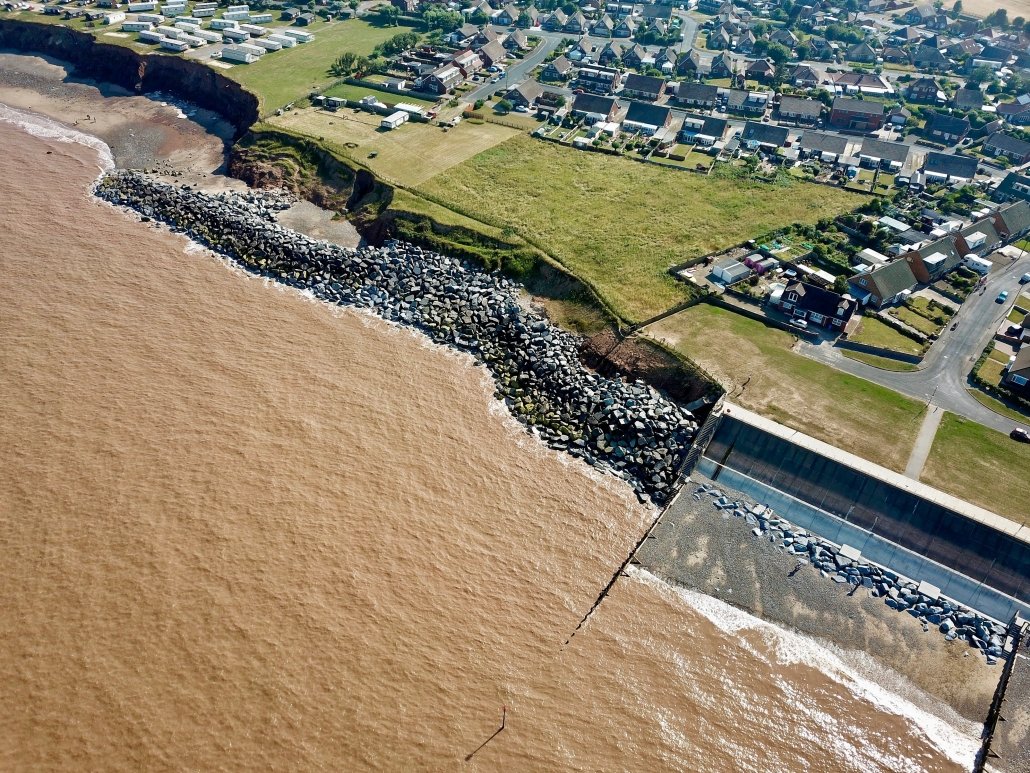
An application has been made to secure funding to extend the coastal defences at Withernsea on the Holderness Coast. The resources below support students investigating the Withernsea Coastal Defences decision-making exercise.
The map below provides an overview of the proposed location of the coastal defences along with information on the existing coastal defences and the impact of coastal erosion in this area.
The image above shows the coastal defences to the south of Withernsea. These include a seawall, wooden groyne and rock armour.
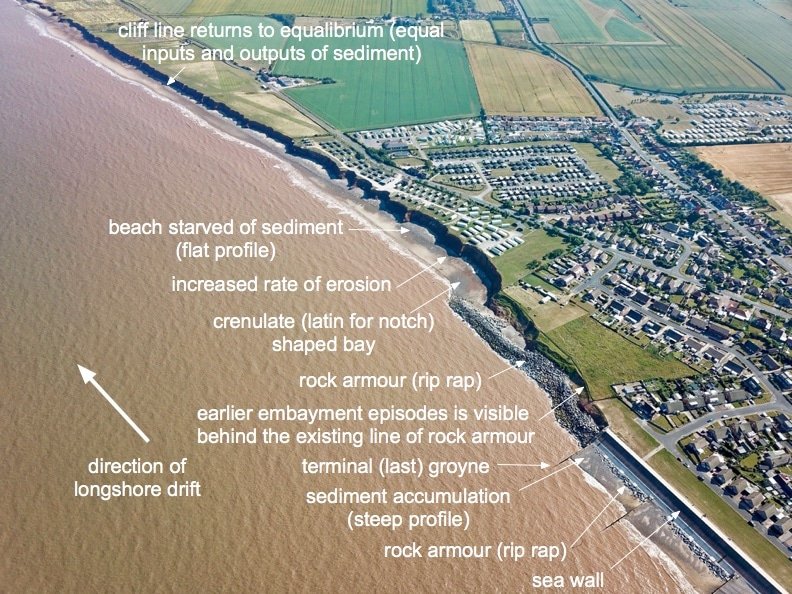
The image below shows the coastal defences at Withernsea and their down-drift impact.
Withernsea – Terminal Groyne Effect
Below is a 360 image captured at Golden Sands Holiday Park.