Investigating links in geography using KnowledgeBase Builder
Geographers see connections in the world, how things interact and inter-relate. Making links in geography involves examining relationships within and across themes. An understanding of these links supports students in seeing how the world is interconnected.
One strategy to encourage students to investigate links could involve the use of concept maps. However, before your students attempt their own concept maps it would be useful to live model links with them. Enter KnowledgeBase Builder.
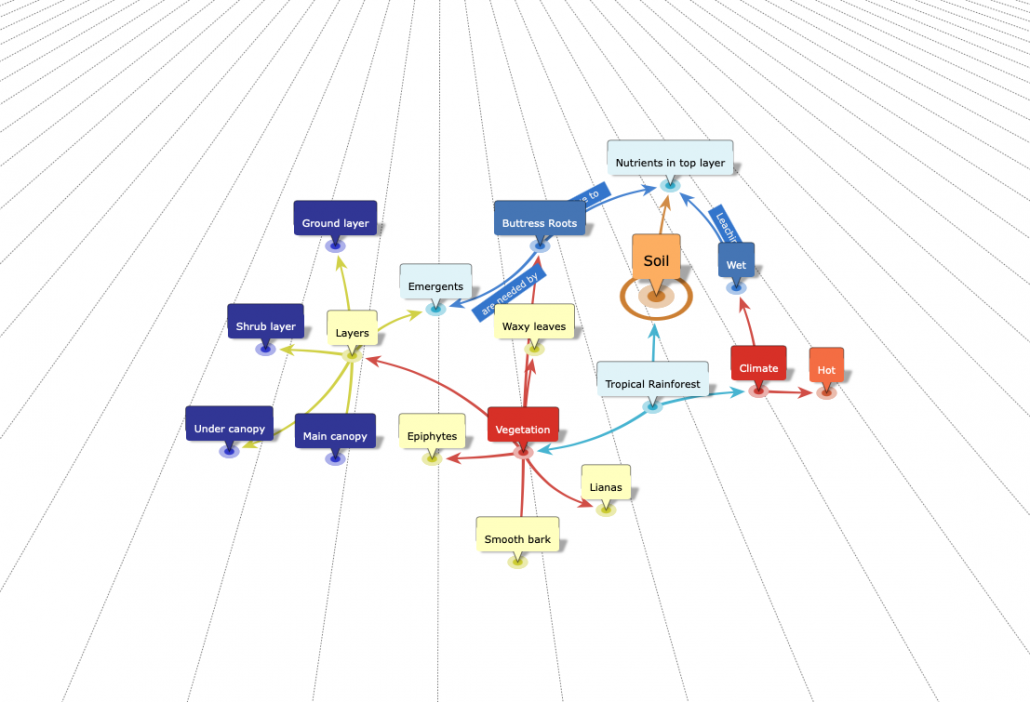
Available for Windows, Android, IOS and Mac OS, KnowledgeBase Builder is a remarkably easy tool to map out curriculum content then investigate links. In the example below, we have produced a simple map the characteristics of the tropical rainforest (for demonstration purposes, there’s lots more that could be added). The characteristics are grouped under headings including vegetation and climate etc. This could be achieved by students contributing key features based on prior learning.
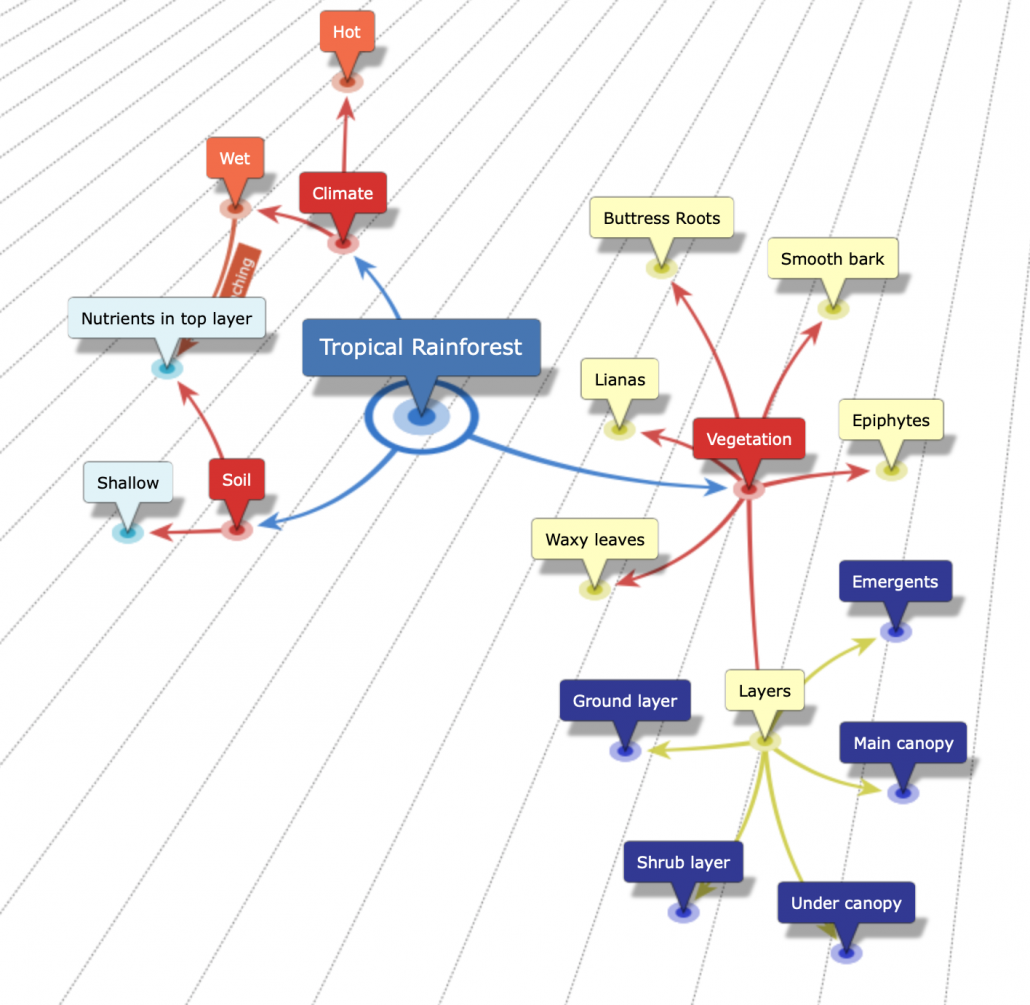
Characteristics of tropical rainforests
Next, it’s time to investigate links between the different characteristics. Simply drag a connection between two elements, give it a simple title and an explanation of how the two are connected. Below is an example of a link between buttress roots and emergents.
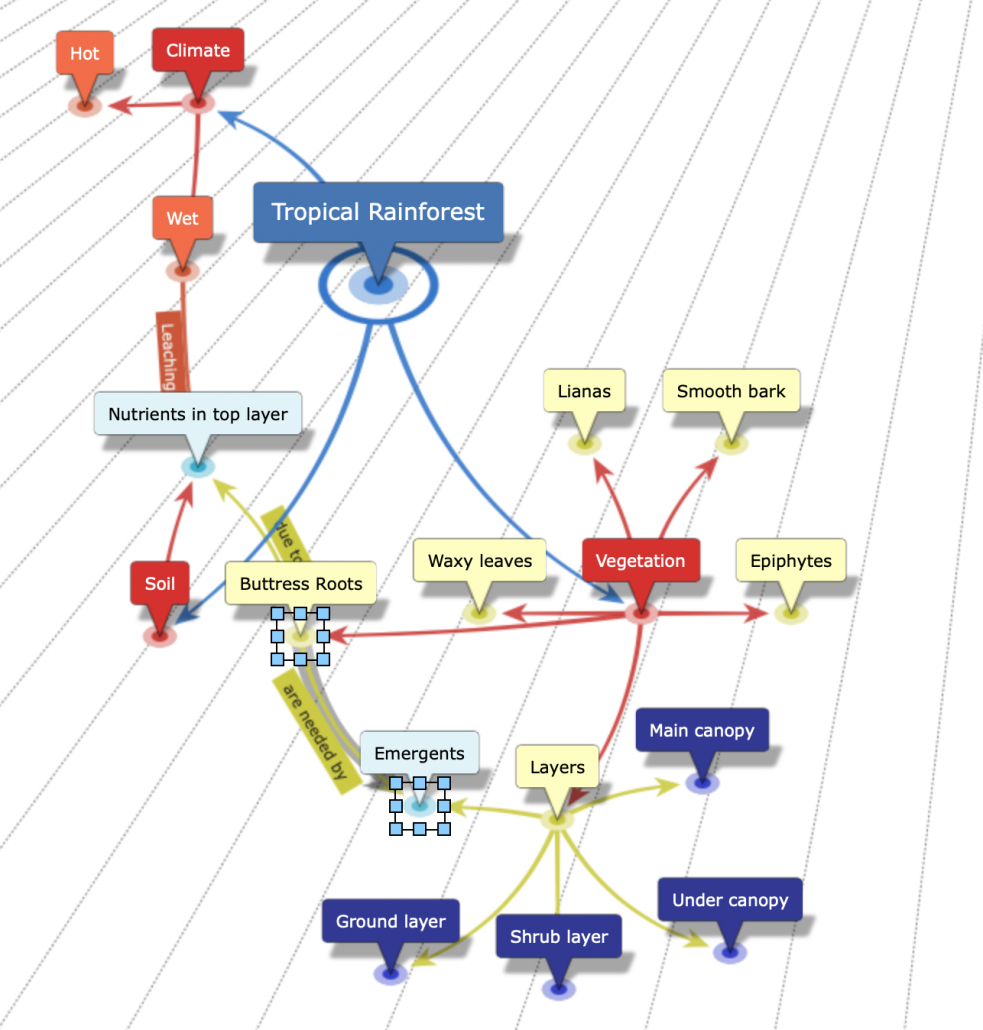
Making a link
Once an explanation has been added in the description box, simply click the link to display the explanation as shown below.
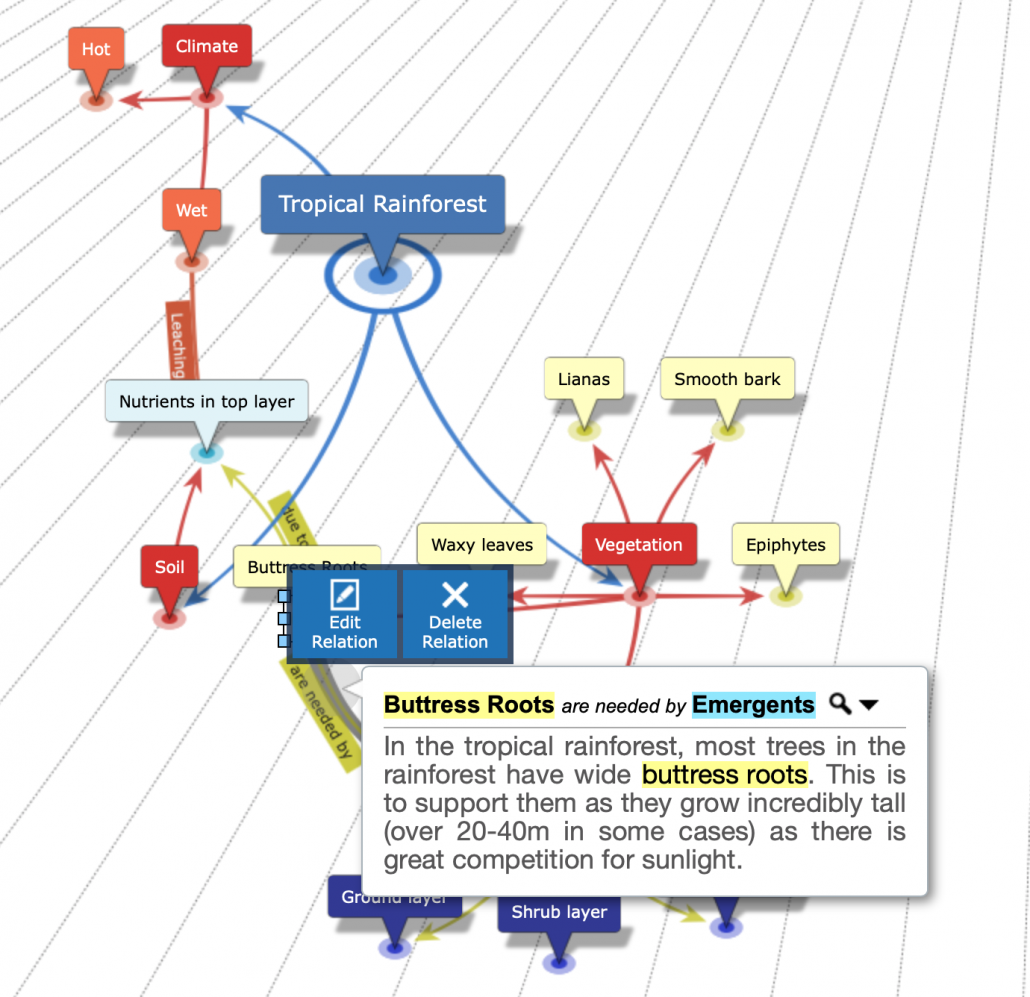
View the link
You can view your map in a range of ways including as a table which shows the main characteristics as shown below.
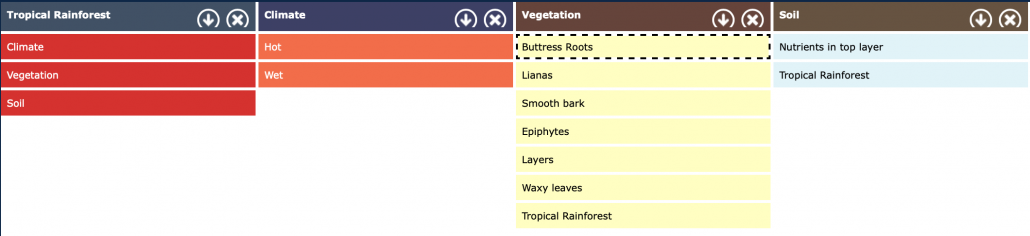
Information presented as a table
You can also view the map in 3D. Which looks pretty fancy! It is possible to save the 3D graphic as an animated gif.
There are several options for exporting your finished diagram. Below is an example of an exported image.
The information can also be exported as an HTML file (web page).
Other features included in the software to explore include:
- adding images
- reverse links where flows/links go in both directions
- adding hyperlinks
- embedding Wikipedia pages
In this example we have explored links within a theme, however, we can just as easily develop a map over time and explore synoptic links in geography.


Leave a Reply
Want to join the discussion?Feel free to contribute!