Create a self-marking quiz using Google Forms
Creating a self-marking quiz using Google Forms is easy. Not only can students complete the quiz using any device but the quiz is self-marking, saving you time. This tutorial takes you through the steps needed to create a quiz like this basic example for coastal erosion.
To get started, head over to your Google Drive and click the New button in the top left corner. Next, click More then click Google Forms.
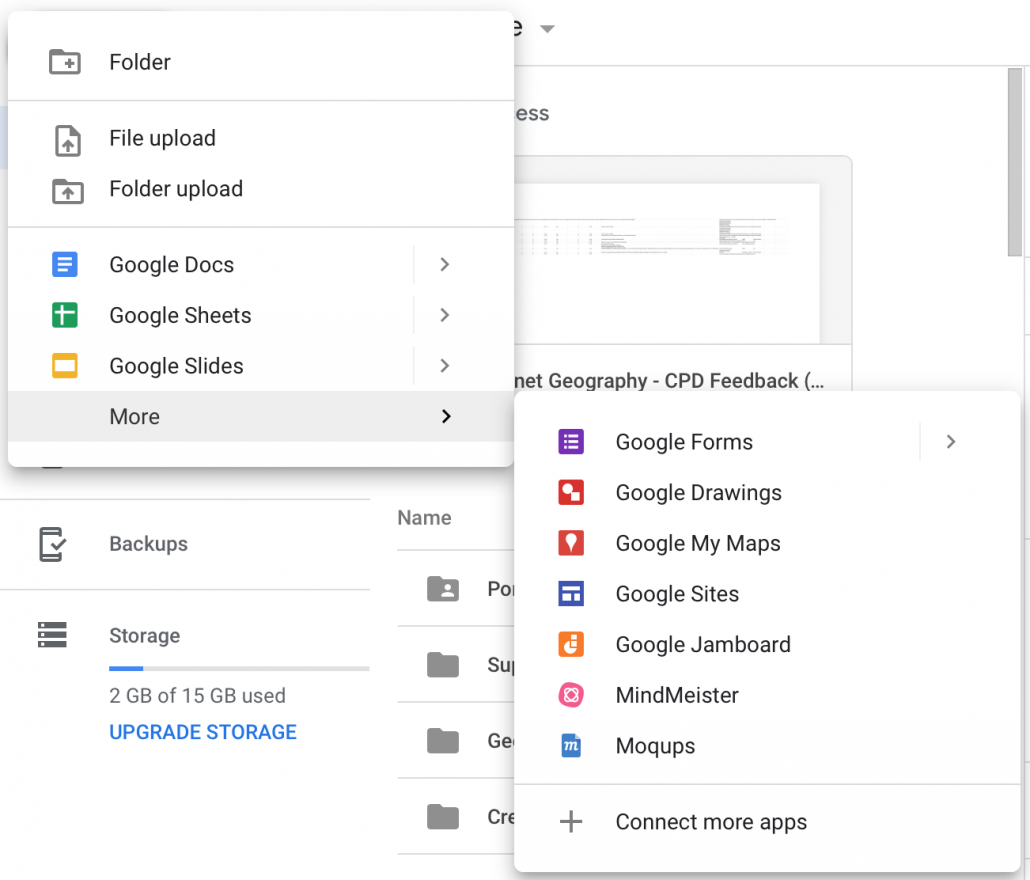
Open Google Forms
When your form is open, click the settings icon (cog) then select the Quizzes tab. This allows you to allocate points to the quiz and allow grading should you want it. Next, click Save.
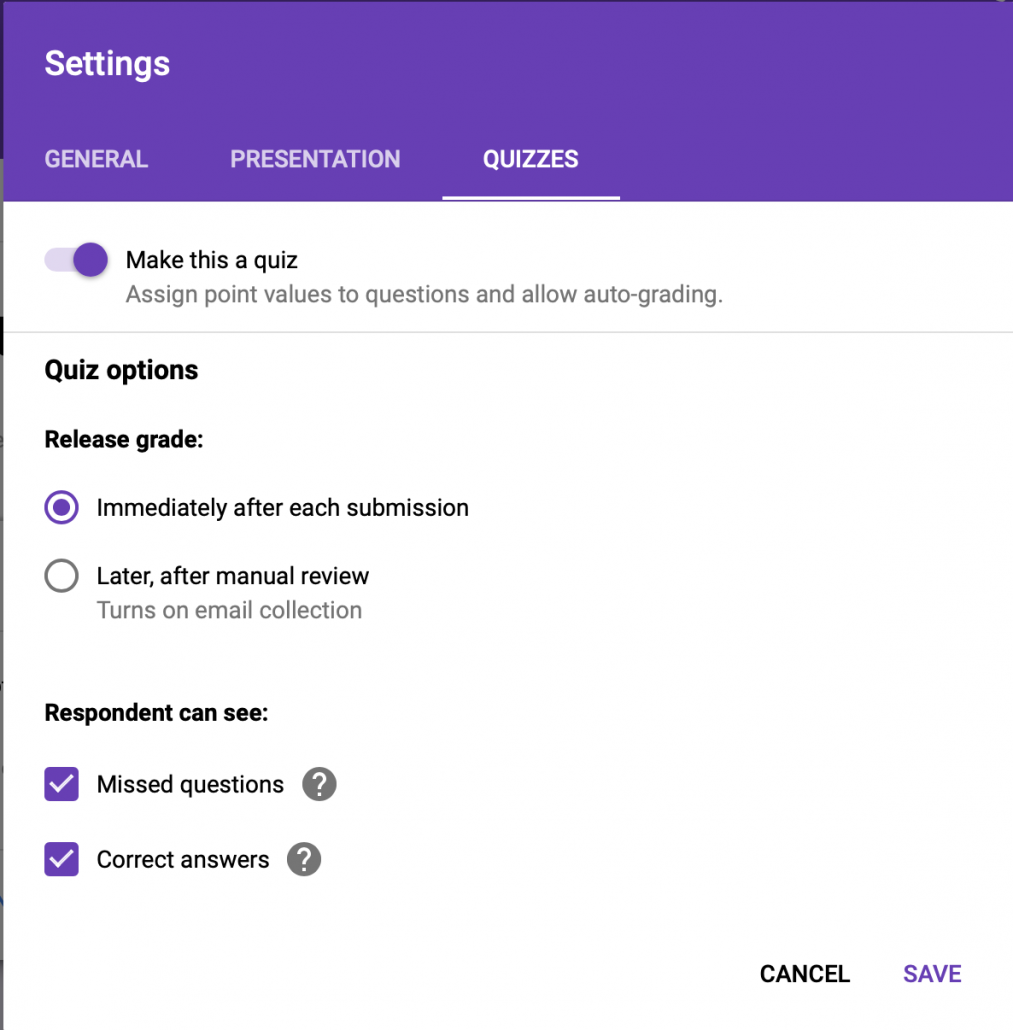
Turn on quiz
Give your quiz a title, by clicking Untitled form and adding a title.
You now need to add fields to your quiz, which can include first name, surname and email address. To begin with type first name into the first question field. Then, select short answer from the answer dropdown. Make sure you click the required slider otherwise students could submit a quiz without adding their name. You can duplicate the question to add surname and email address.
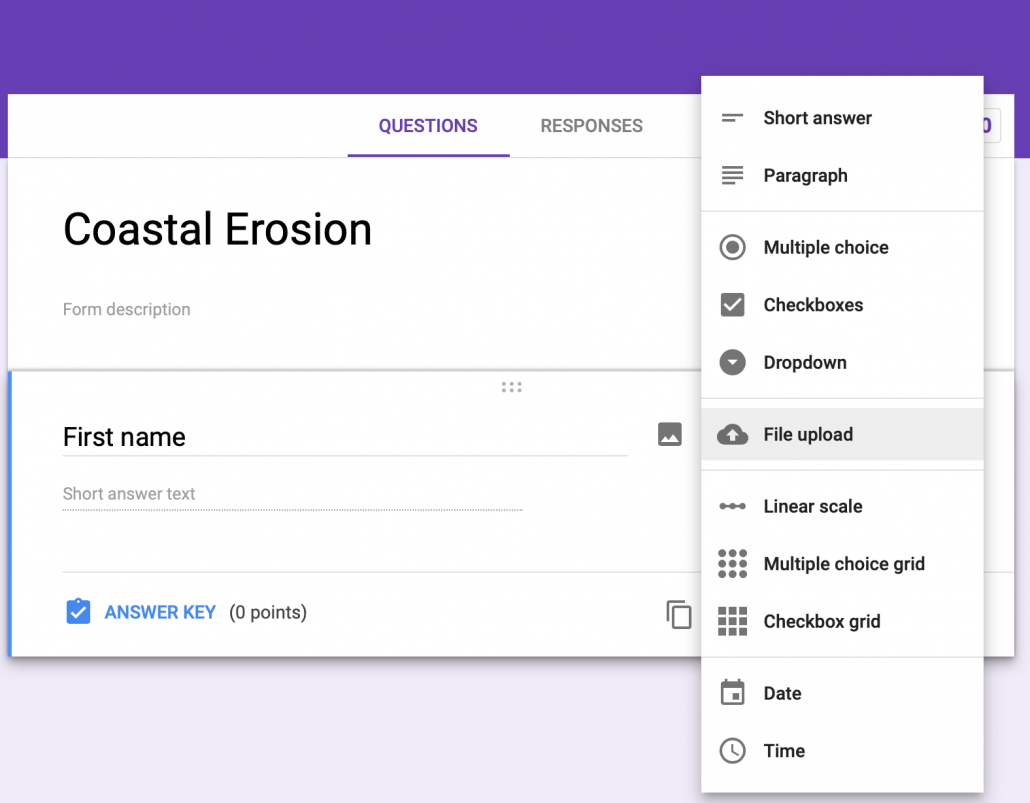
Adding name fields
When you’ve added the email address field you will have the option to collect email addresses. Click the link to enable this.
Your form will look something like the example below.
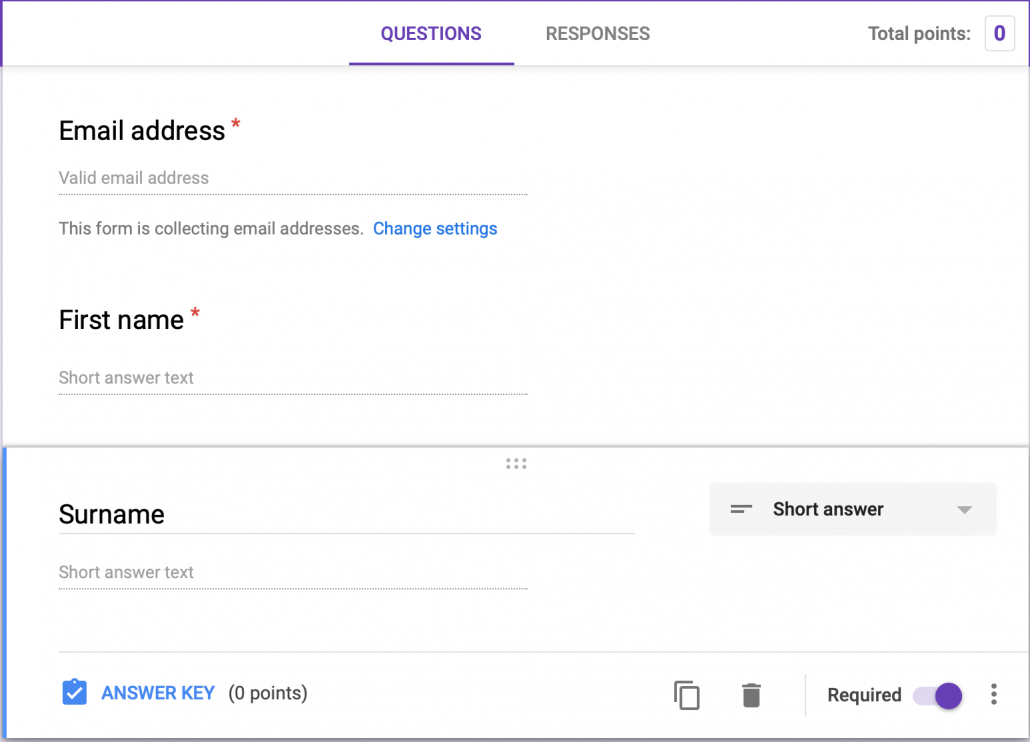
Collecting details for your quiz
Next, you need to add your questions. You can add multiple choice questions, multiple answer questions and short answers.
Below is an example of a multiple-choice question. Remember to select Required so that students ahve to answer the question.
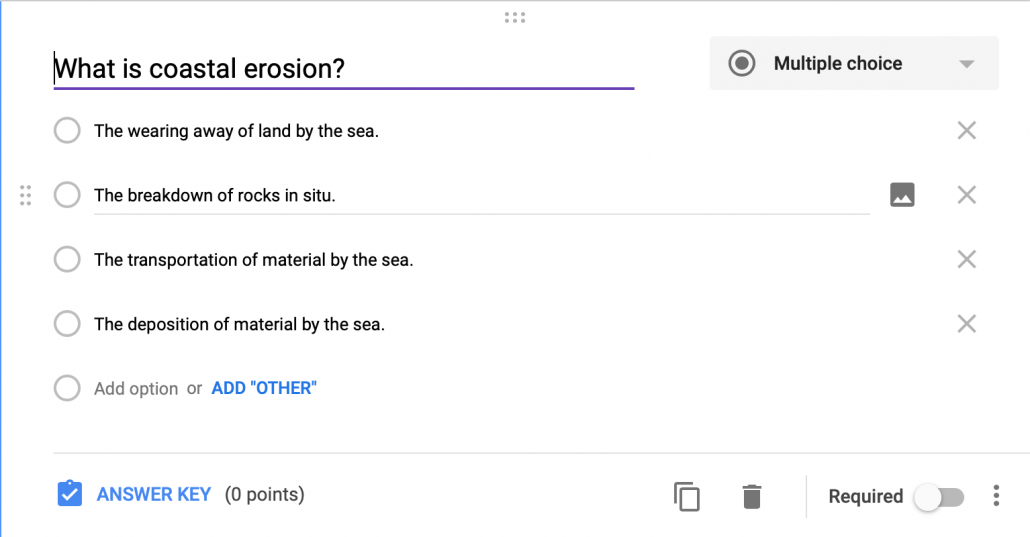
Example multiple-choice question
Once your written your multiple-choice question, click ANSWER KEY. Next, identify the correct answer and allocate the number of points available for correctly answering it. You can choose to add answer feedback too if you wish to.
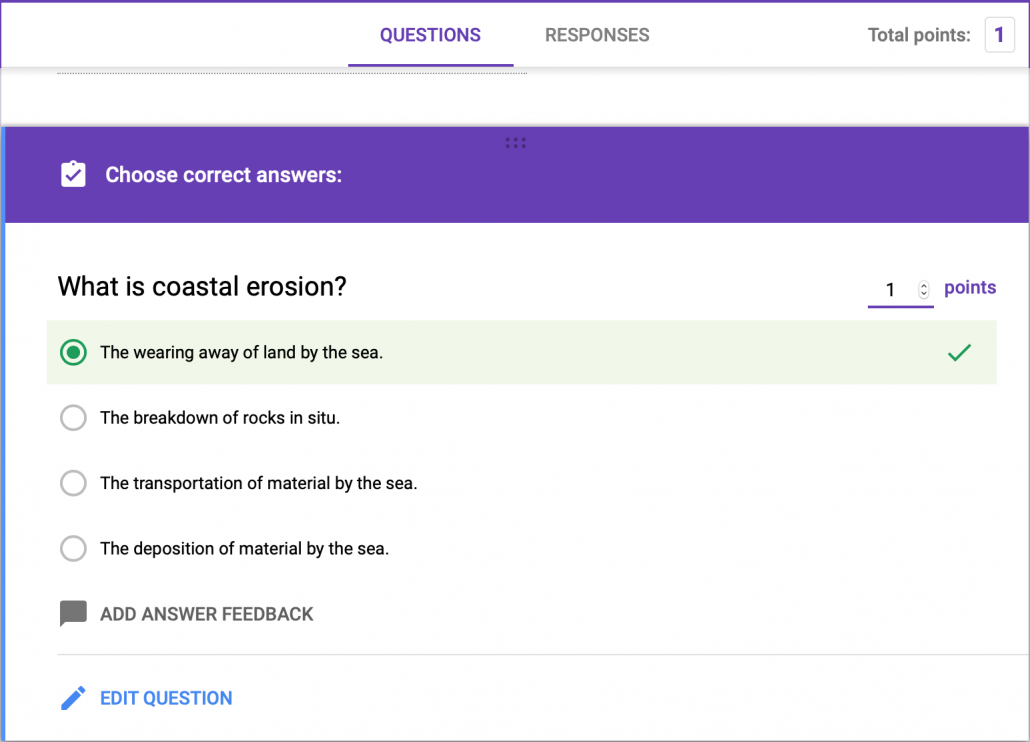
Identify the correct answer and allocate points
Add the remaining questions you want to ask.
When you are ready to test your quiz click the preview icon at the top of the screen. This will take you to the live quiz (you can copy the web address and share it with students – if you are not sharing this electronically you might want to shorten the web address (URL) by visiting TinyUrl.
Once you have shared the quiz you can check results by clicking the Responses tab. You can review the performance of your students by exploring the options. If you want the results in a spreadsheet format, just click the Sheets icon below Total points. This will create a spreadsheet containing all the responses.
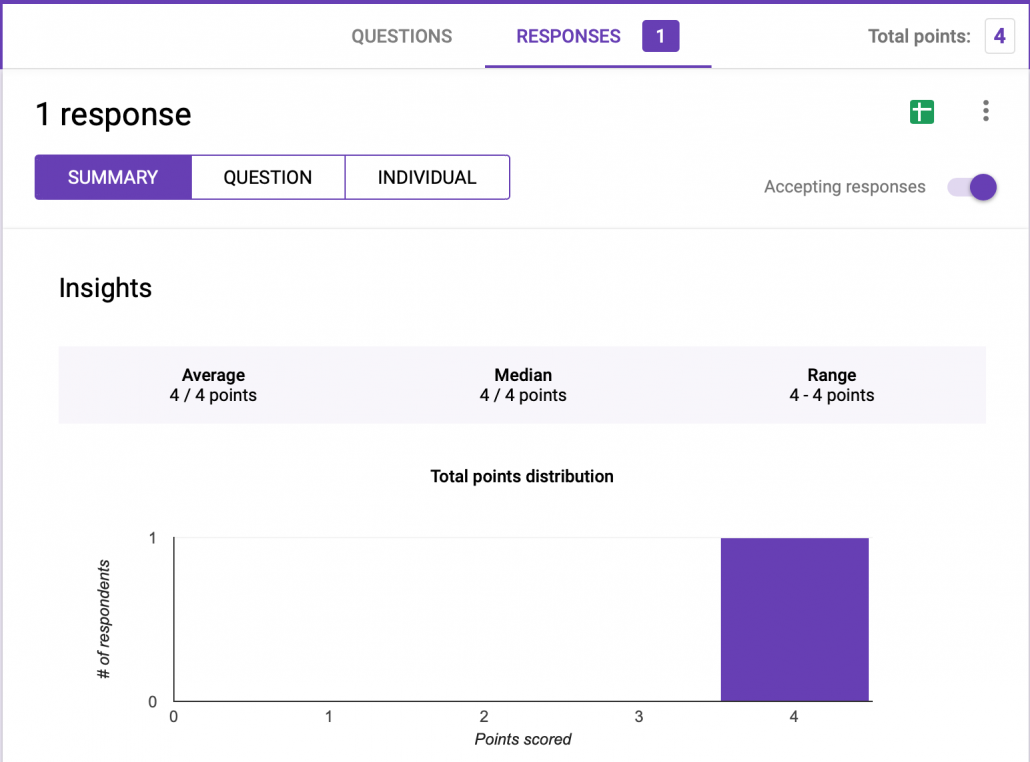
Responses
Did you know? If you subscribe to Internet Geography Plus you’ve got access to a number of multiple-choice question booklets. You can copy and paste questions and answers from these booklets to create digital versions of the multiple-choice resources. Please note, if you use our questions please don’t share the quizzes with people or students outside of your classes if you have an individual subscription or your school if you have a department subscription.
Have you seen our quizzes on Internet Geography? Save time creating your own by using ours!
Next Steps
Once you’ve set up your quiz installing a simple add-on lets you analyse the data you have collected. Take a look at this post to find out how: Analysing data from a self-marking quiz using Google Forms with Flubaroo.