Tag Archive for: GIS

Google Earth – Create interactive stories and maps

Google Earth has recently launched creation tools allowing you to create stories and maps. Having had a play with the new feature I have to say it’s fantastic. Not only can stories and maps be shared with others to view, but you can also collaborate on the same map in real-time. You must use the Google Chrome browser to access Google Earth online.

Take a look at an example I’ve started working on for the Holderness Coast (you need to be using the Chrome Browser to access this!). This is a work in progress but helps give a feel of what is possible. I’ve also created an example showing landforms of glacial erosion and how these appear on OS maps.

Having followed the tutorial below, Louise Hayne has kindly shared two amazing Google Earth case studies covering the 2011 Sendai, Japan earthquake and the Haiti earthquake. Give Louise a follow on Twitter via @louhayne1.


The software is very intuitive and many features can be worked out through having a play. However, I’ve put together a step by step guide covering some of the main features for those who feel less confident about using GIS software below.

Introduction to creation tools in Google Earth

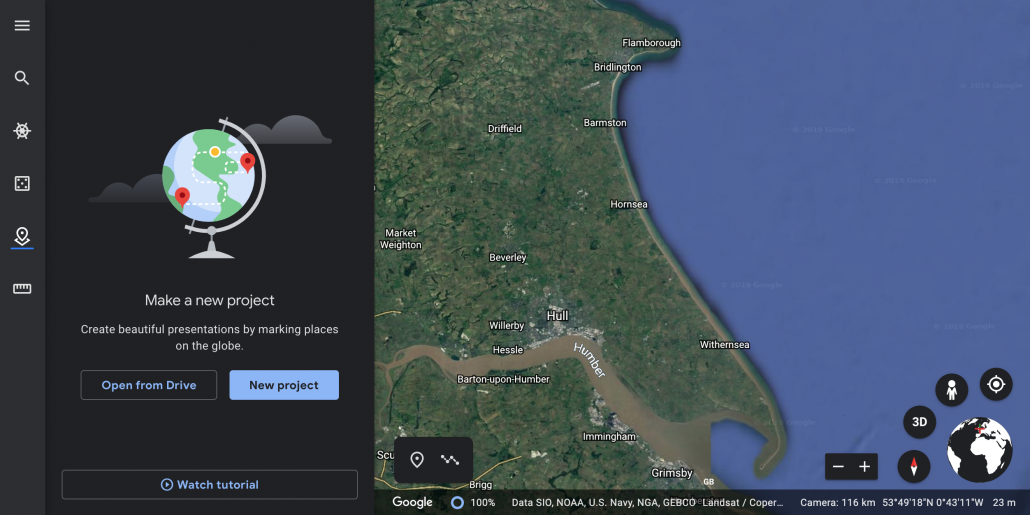
  1. Open Google Earth online using Google Chrome. Click the New Project icon
    Google Earth - Step 1

    Google Earth – Step 1


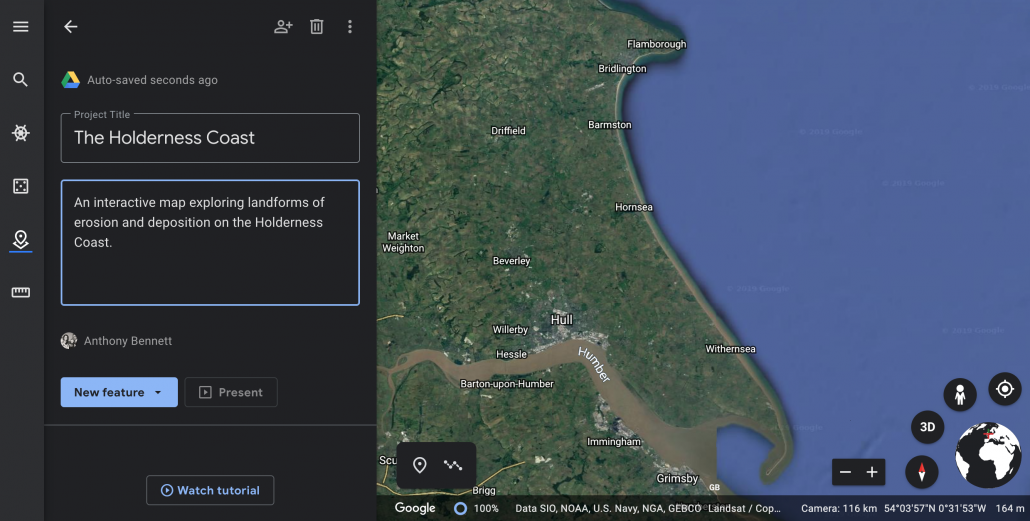
  2. Give your project a suitable title and description
    Google Earth - Step 2

    Google Earth – Step 2


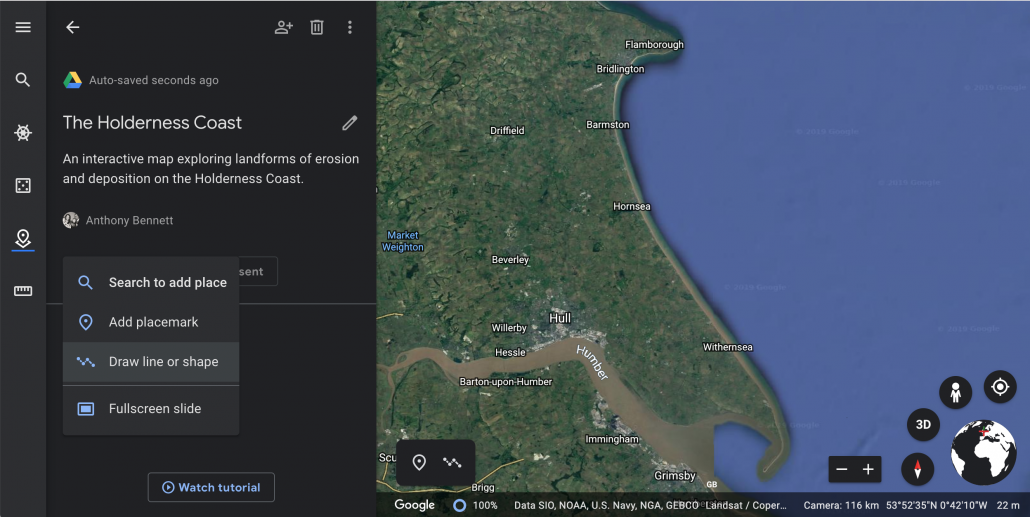
  3. Click new feature > draw line or shape.
    Google Earth - Step 3

    Google Earth – Step 3


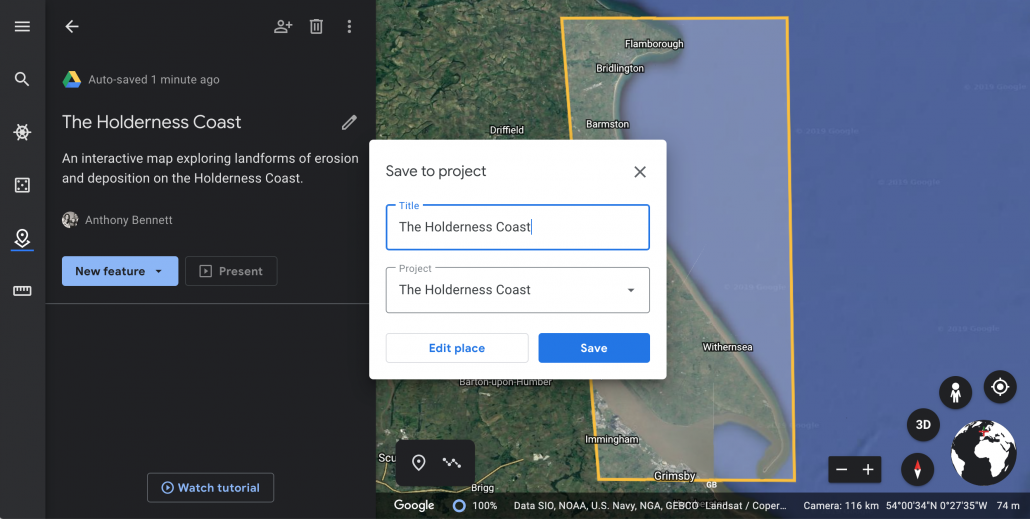
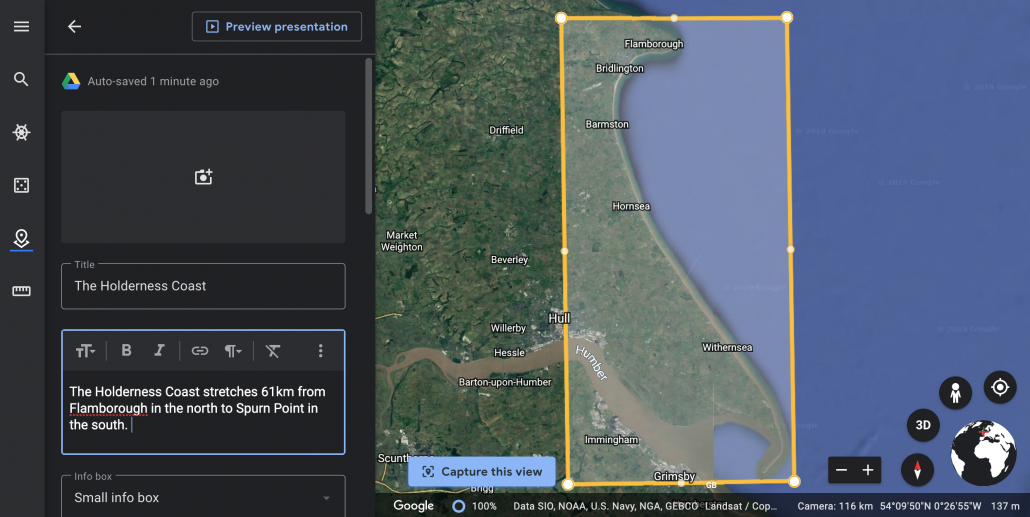
  4. Draw a shape around the case study area. Give it a title.
    Google Earth - Step 4

    Google Earth – Step 4


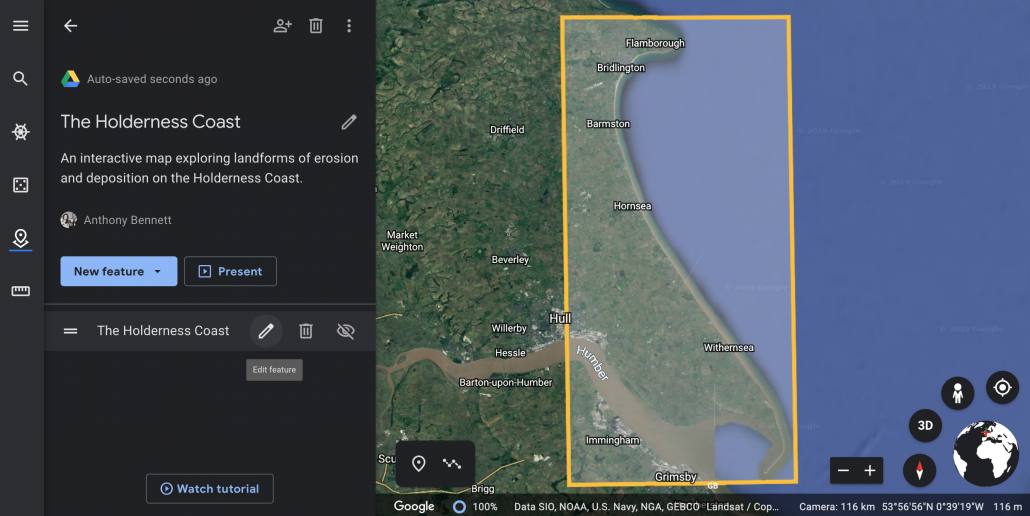
  5. Click edit place to tidy up the shape.
    Google Earth - Step 5

    Google Earth – Step 5


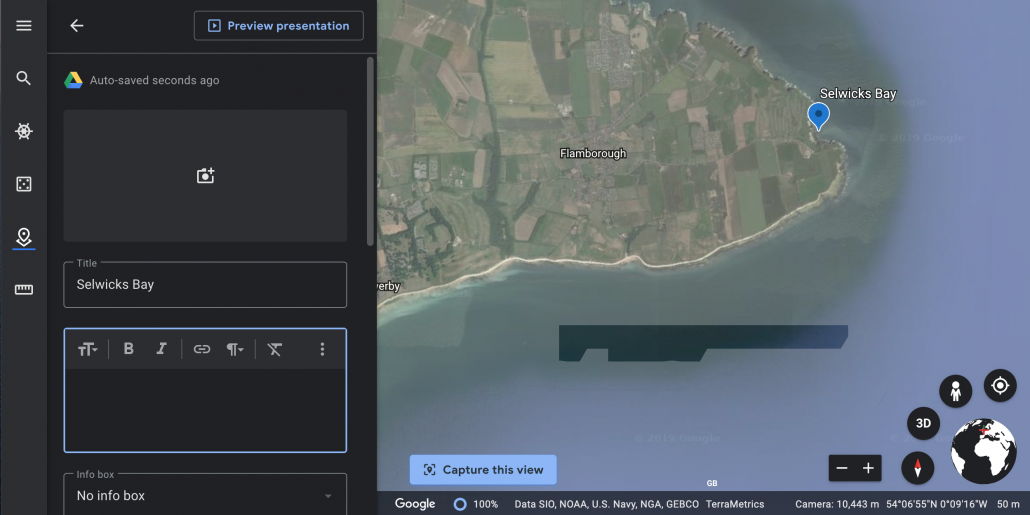
  6. Add a description and click the Capture this view icon so whenever someone clicks the location it will zoom to this view.
    Google Earth - Step 6

    Google Earth – Step 6

    You can also add an image by clicking the camera icon. When you’ve finished click the back button in the top left corner.

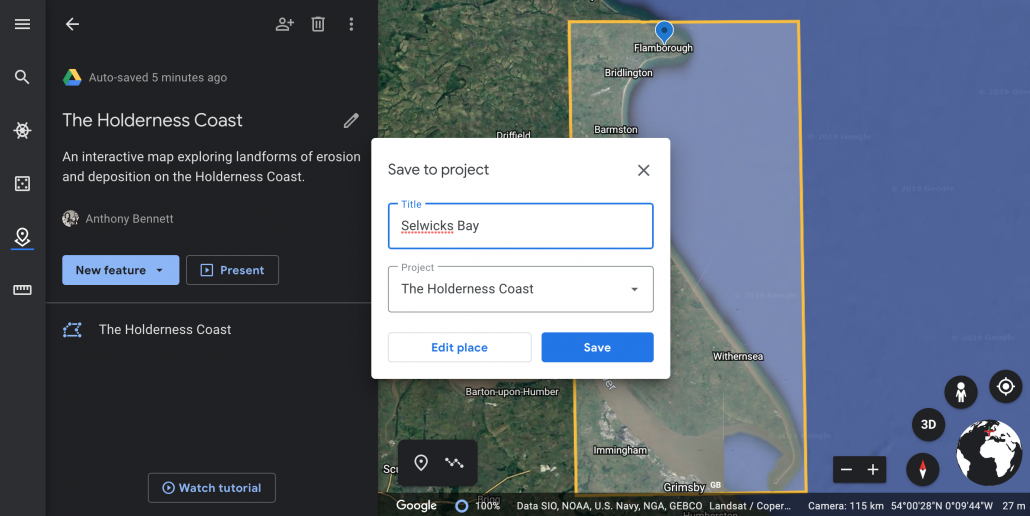
  7. Next, start adding place makers for different locations by clicking the New feature button and selecting either add placemark to add the location manually or search to add place.
    Google Earth - Step 7

    Google Earth – Step 7

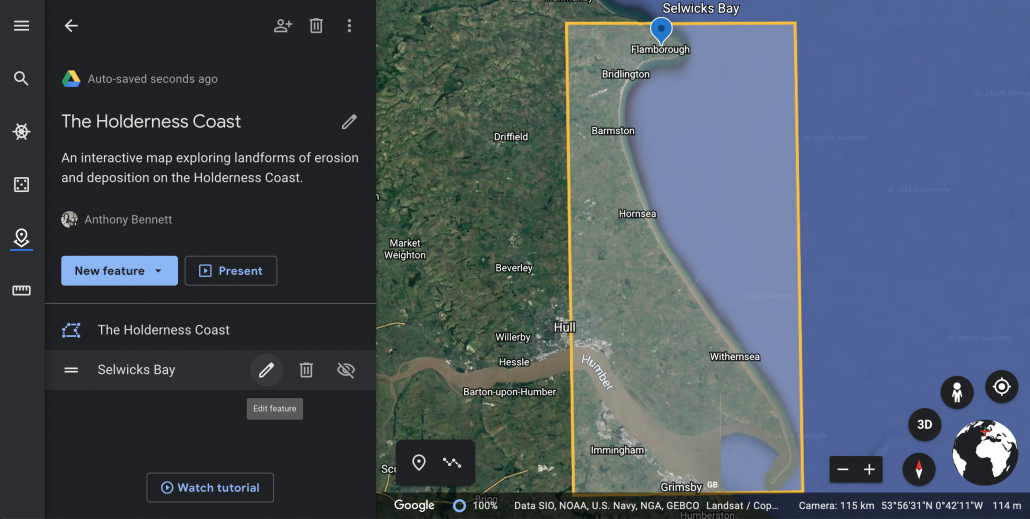
  8. Once you’ve added your placemark you can edit is by hovering over the location in the menu on the left.
    Google Earth - Step 8

    Google Earth – Step 8


  9. Click the pen icon to edit.
    Google Earth - Step 9

    Google Earth – Step 9


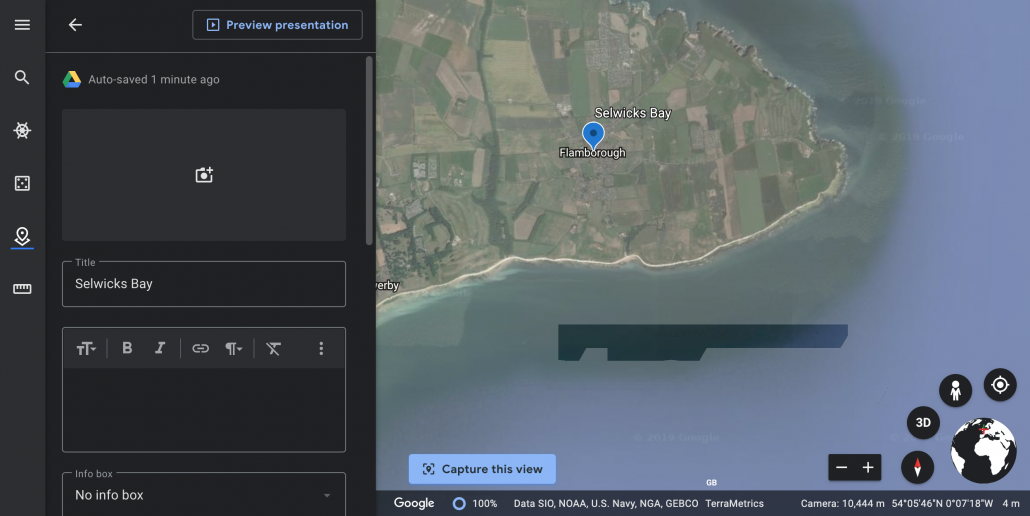
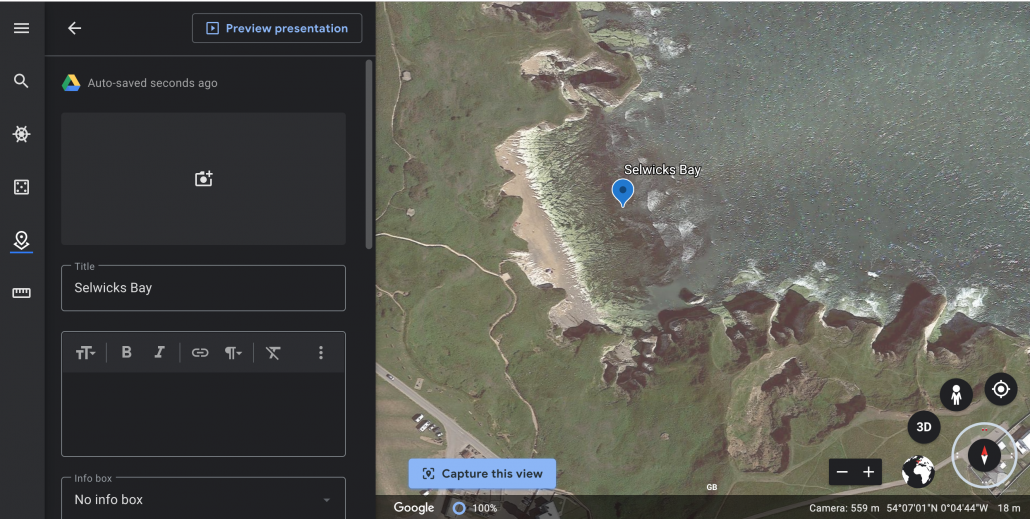
  10. Zoom into the location to move the place marker into a more accurate position. Drag and drop the place marker to move it.
    Google Earth - Step 10

    Google Earth – Step 10


  11. You can zoom closer to the location and change the default view.
    Google Earth - Step 11

    Google Earth – Step 11


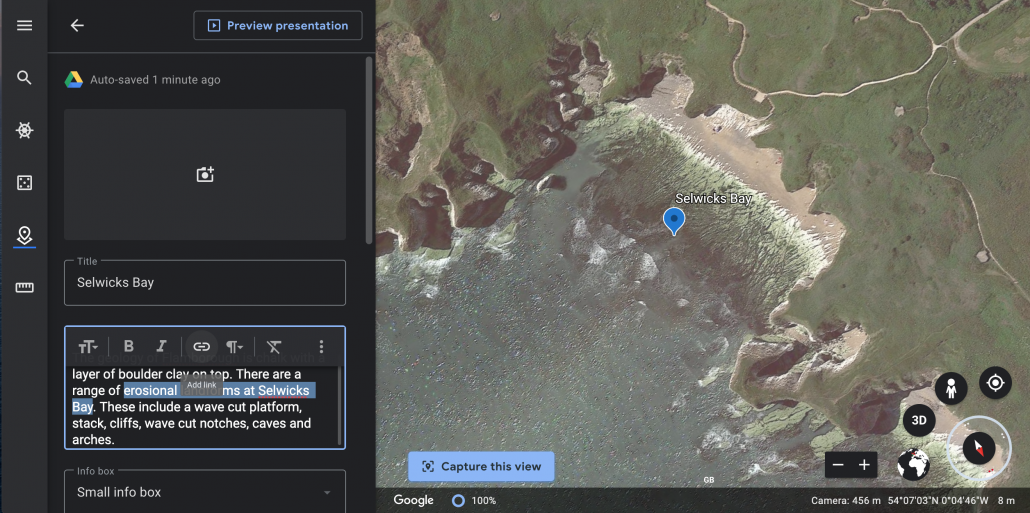
  12. To do this zoom in then click the compass icon. You can now change the viewing angle by using the enlarged compass icon. When you are happy with the view click Capture this view.
    Google Earth - Step 12

    Google Earth – Step 12


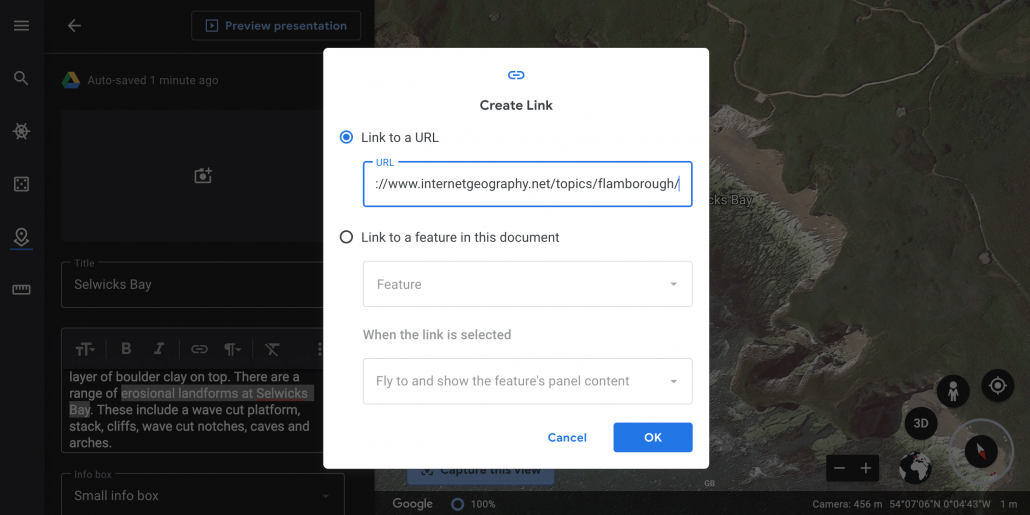
  13. You can add links to the text you include in the description. Highlight the text you want to become a link and click the link icon. In this case, a link has been included to more detailed information about landforms of erosion at Flamborough on Internet Geography.
    Google Earth - Step 13

    Google Earth – Step 13


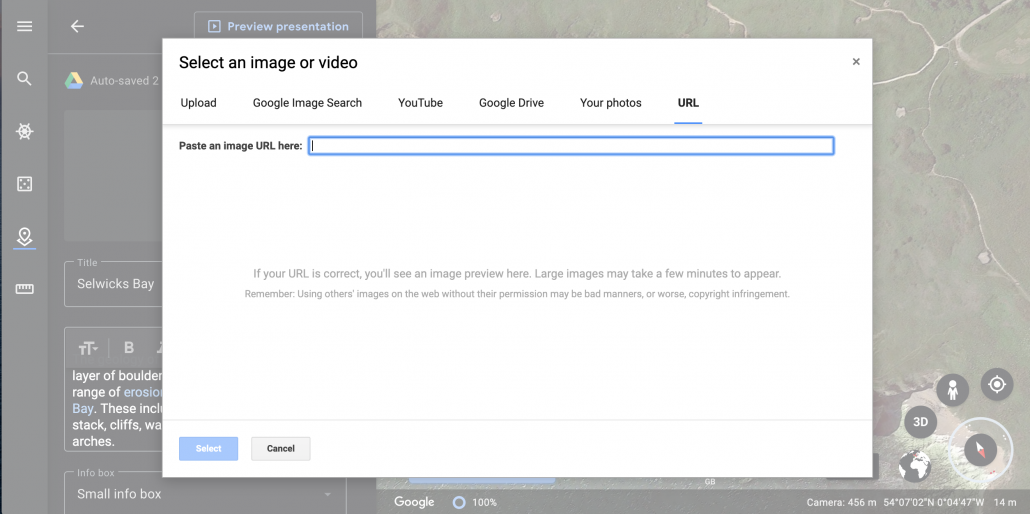
  14. Adding an image is easy, simply click the camera icon and choose the source of the image you want to use. Multiple image can be included.

    Google Earth - Step 14

    Google Earth – Step 14


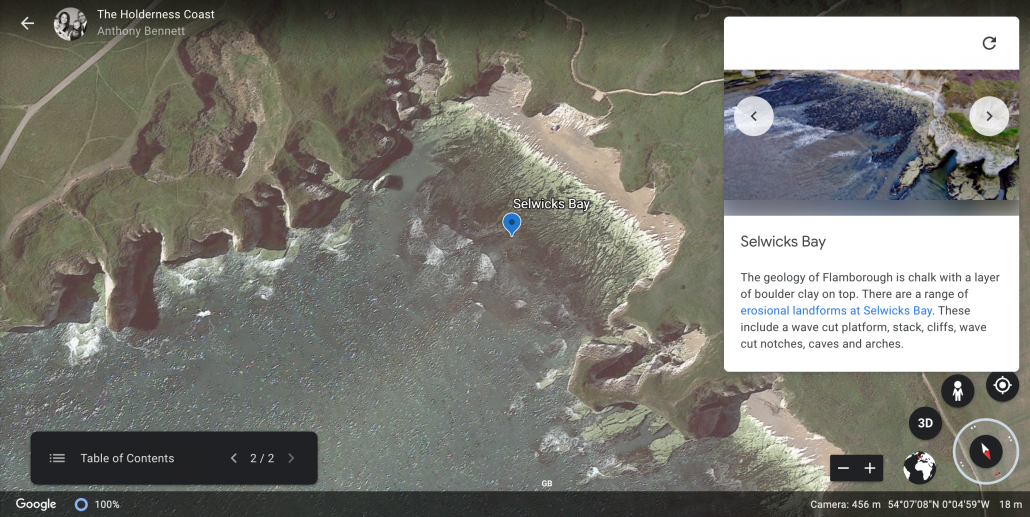
  15. You can review your presentation at any time by clicking Preview presentation.
    Google Earth - Step 15

    Google Earth – Step 15


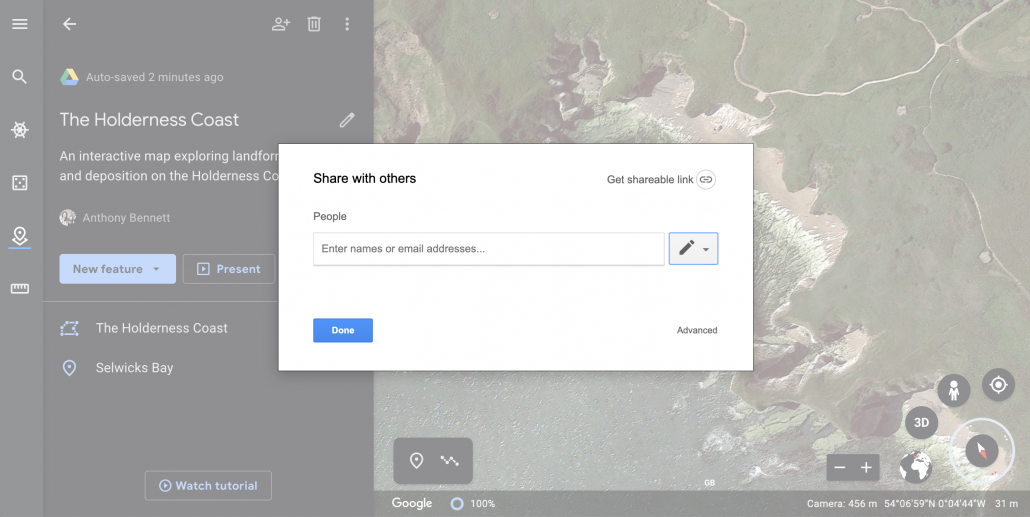
  16. By clicking the share button you can share your map. When you share you can choose to either allow people to view or edit. By allowing people to edit the map you can collaborate on the map with other people at the same time!

    Google Earth - Step 16

    Google Earth – Step 16

It’s also possible to embed 360 images from Google Maps into your stories and maps. The video below explains how to do this!

Garmin eTrex vs iPhone for GPS accuracy

During a CPD session at Hornsea on Friday 21st June 2019 I recorded the location of the cliff edge adjacent to Longbeach Leisure Park using an iPhone and a Garmin eTrex 30 GPS device. I was keen to find out how the iPhone and the dedicated GPS device compared. 

The map below shows the routes recorded by both the iPhone 7S and the Garmin eTrex. On the map below the Garmin route is plotted using a blue line and the green line shows the route recorded by the iPhone. It is clear that the iPhone GPS is, in some instances, around 5m out compared to the Garmin eTrex. In some cases the route is recorded over areas of cliff that no longer exist. The start location of the iPhone is out by quite some distance despite starting the routes at exactly the same time. The iPhone records waypoints more often I’m sure there is a setting in the Garmin to adjust how often waypoints are recorded (I’ve just started playing this). 

It is possible to display the recorded route of the coastline that I recorded on the same iPhone back in March. Comparing the two routes recorded on the iPhone, there are clear inconsistencies where the cliff edge appears to extend outwards since the last recording! 

It is worth noting that both devices were held in the same hand at the same time. I’m not sure if GPS signals from different devices can interfere with each other, further reading to do on this. 

As expected the dedicated GPS device is considerably more accurate at recording routes than the iPhone. However, the iPhone is perfectly adequate for regular leisure use. 

Anthony Bennett

Christchurch Earthquake Animated Map

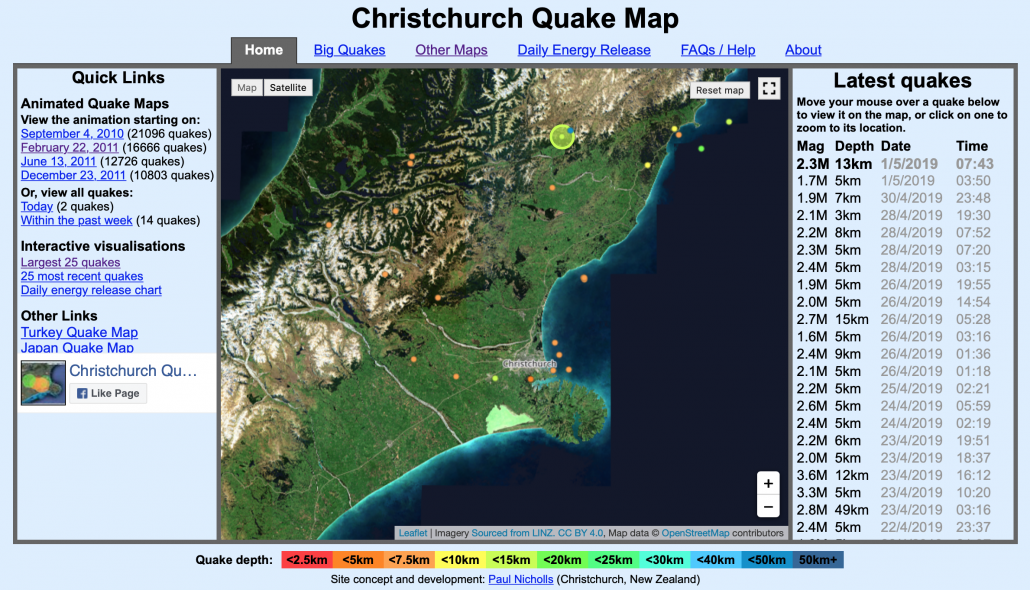
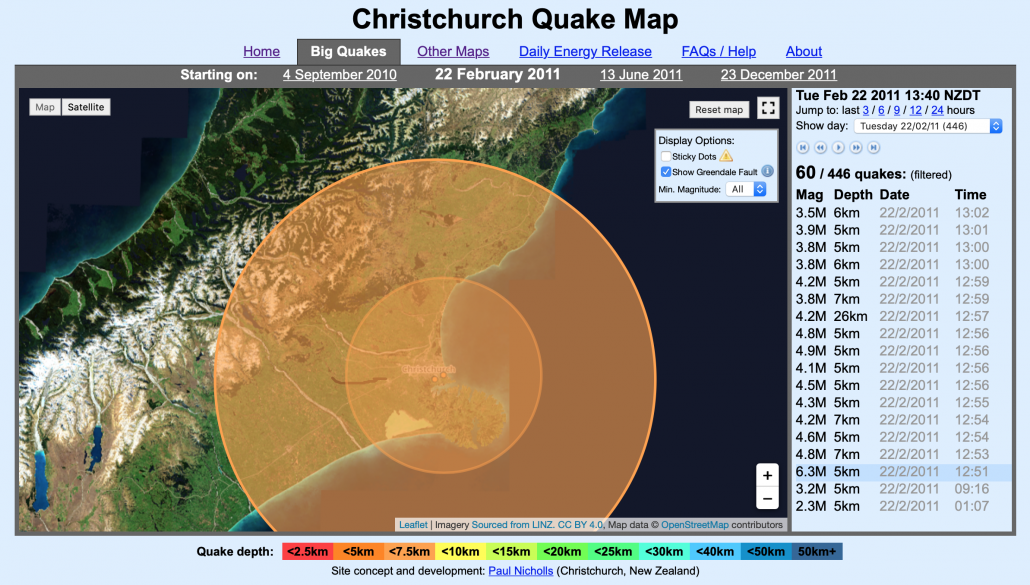
Christchurch earthquake map is a fantastic resource for illustrating the swarm of earthquakes that occurred on February 22nd 2011, when 185 people were killed as the result of a magnitude 6.3 quake.

To access the resources head over to the Christchurch earthquake map

Christchurch Earthquake Animated Map

Christchurch Earthquake Animated Map

Next, click February 22, 2011 under quick links (on the left of the page). The animation will start automatically. The magnitude and depth of the earthquakes are illustrated using coloured proportional circles.

2011 Christchurch Earthquake Map

2011 Christchurch Earthquake Map

You can speed up and slow down the animation using the media controls to the top right of the page.

We’ve recently added Christchurch earthquake case study resources on Internet Geography.

Creating simple topographic profiles

Creating Simple Topographic Profiles

Pontypridd Profile

Pontypridd Profile

In this post, David Caplin illustrates a simple way of capturing topographic profiles using free, online tools. 

Topographic Profiles are a very good visual way of representing a section of terrain. There are a number of different uses for topographic profiles in Geography. In terms of Coastal Management, they can be easily used to illustrate how the coastline has changed under the presence of erosion or deposition.

There are a number of ways of producing profiles, and which one to use largely depends on what you actually want to use it for!

If you just want a simple profile, for a river valley, for example, or cross-section of a mountain range, you don’t need mm level accuracy and up-to-date data, you just need a general overview of the terrain. A brilliant tool for this is the HeyWhatsThat Path Profiler tool.

Hey What's That Path Profiler Tool

Hey What’s That Path Profiler Tool

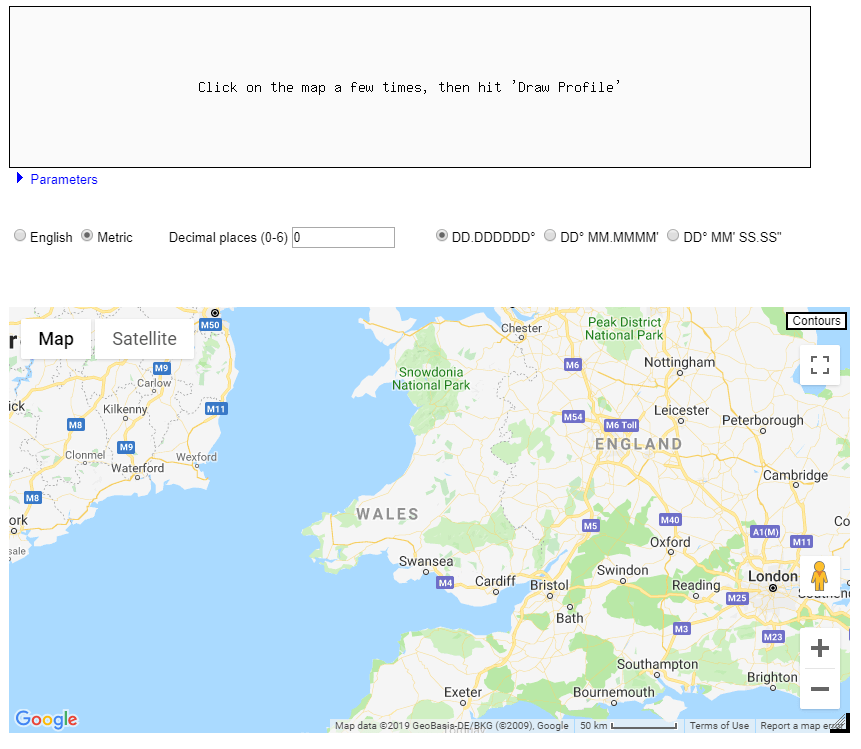
The Path Profiler tool is very simple to use. It has a Google Maps Interface, and by left clicking on the map, you can create points on the map. A line will be drawn between the two points and the profile drawn automatically in the little window above it. Here is an example of it:

Example of a line drawn on HeyWhatsThat Path Profiler tool

Example of a line drawn on HeyWhatsThat Path Profiler tool

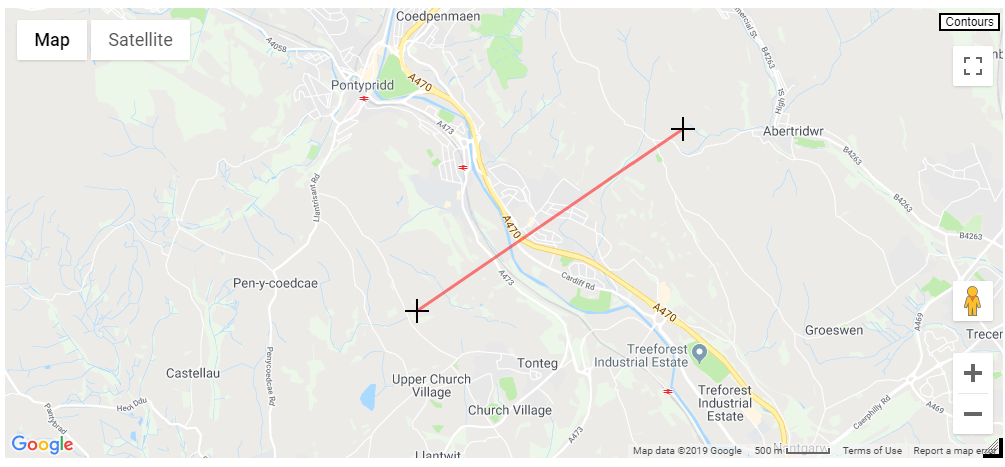
If we want to have a look at the valley profile in this section of the Taff Valley in South Wales, we can drop our two points either side of the valley, and the profile is generated from that transect:

Pontypridd Profile

Pontypridd Profile

You can customize the display of it through the settings on the page, for example changing units. The profile can be copied/pasted or saved for further use.

Now, this is a really quick and simple tool for producing profiles, but it is neither up-to-date nor especially customisable. If you’re looking for something that is much more customisable, and able to use the latest data, you’re going to need to use a fully-fledged GIS package, such as QGIS.

By David Caplin

Lecturer in Agriculture
Bridgend College


Map your photos using Google Maps

Using Google Images and Google Maps you can easily create a map using an album of geotagged photos. Geotagged photos are those that include data on the location they were taken. Most modern mobile phones have this feature as do some digital cameras. If you are not sure a quick search on the Internet will tell you if this option is available and how to enable it.

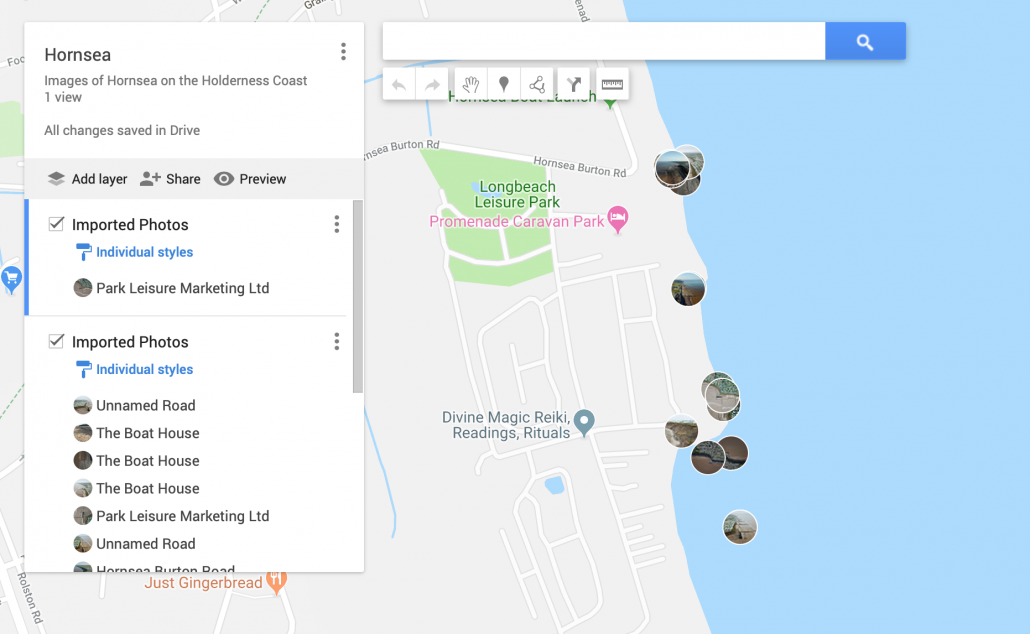
Below is a map showing the location of a number of images taken in and around Hornsea on the Holderness Coast using an iPhone and a drone.

Looks complicated? Don’t worry, it’s not! Just follow the steps below.

To begin with, you will need to upload your geotagged photos to a new album in Google Photos. To do this login to your Google account and go to https://photos.google.com. Next create a new album by clicking +Create in the top right corner, then select Album.

Give the folder a title then upload the images you want to map.

Next, go to https://www.google.com/maps/d/ and select +Create New Map (top left corner). Your new map will open and be called Untitled map. Give your image a suitable title by clicking untitled map in the top left window.

Rename your map

Rename your map.

Click Save.

Next click Import (under the first layer which is called Untitled layer).

Click import

Click Import

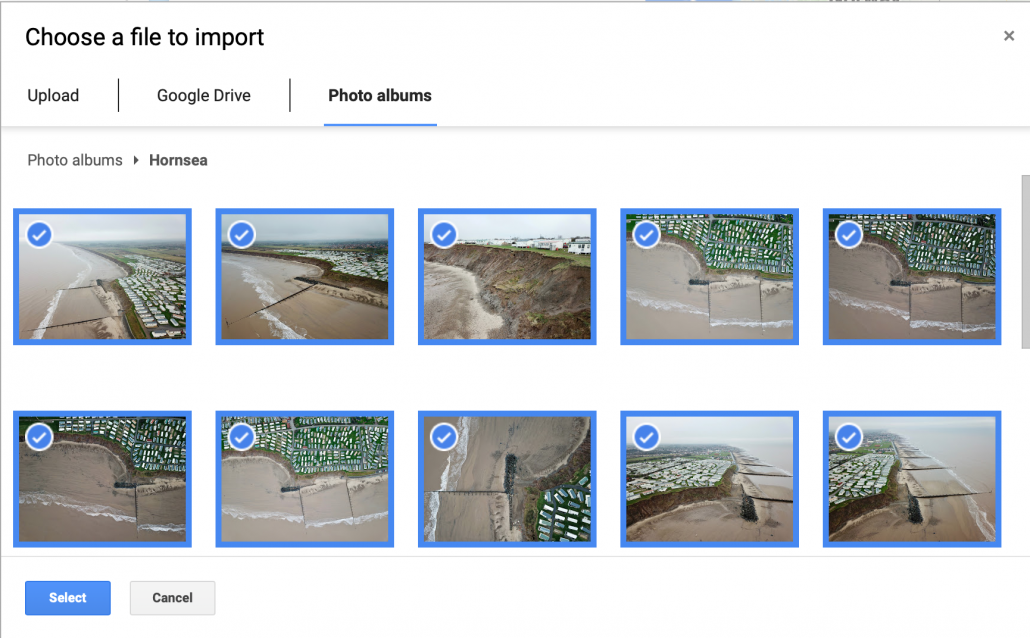
Click the Photo albums tab. Next, locate the album where your photos are stored. Select all the images you want to import onto the map.

Select images you want to import

Select images you want to import

Next, click Select. The photos will then be copied onto your map.

This will create at least one layer containing your images and an icon of each image will be displayed on the map.

Imported images and new layers

Imported images and new layers

You will notice that each photograph has been given a title based on the location it was taken. You should go through these and rename them as appropriate. Once you’ve finished you can share your map with others by clicking Share > Change > On. You can then share the URL. You can also embed the map on a website by clicking the three dots next to the map title. Then select Embed on My Site.

Creating a case study map in Google My Maps

Creating a case study map in Google My Maps

Google My Maps is a great way of collating and displaying case studies in one place. Below is an example that includes some of the case studies on Internet Geography.

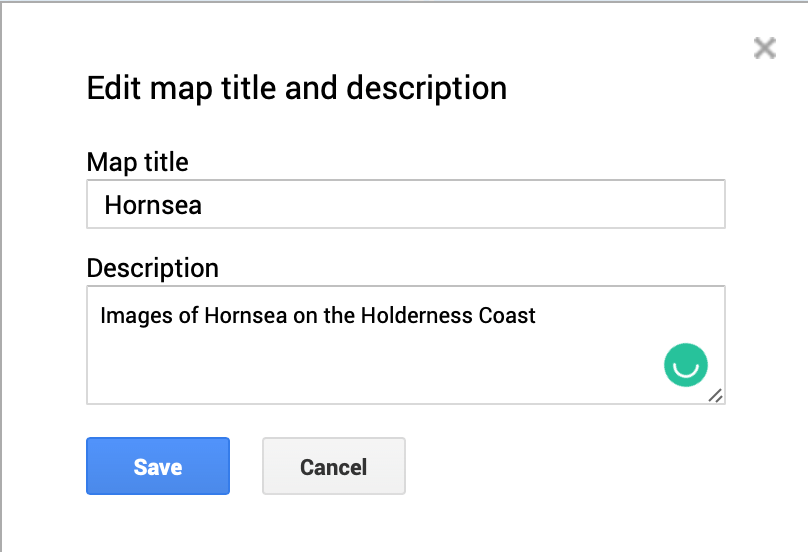
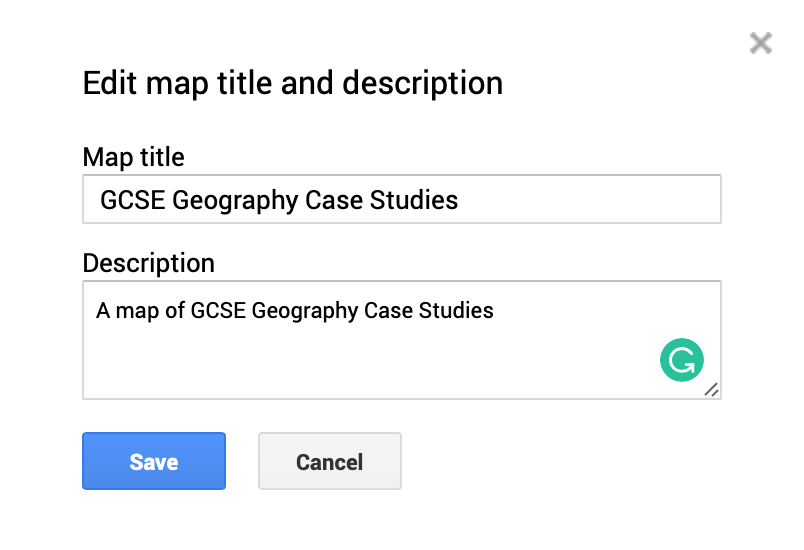
To get started on your map log into your Google account then head over to Google My Maps. Click New Map and give it a suitable title and description.

Edit map title and description

Edit map title and description

In this map, we are going to create a series of layers. This is so that we can group case studies by themes. By doing this we can filter case studies by type and display them on a base map.

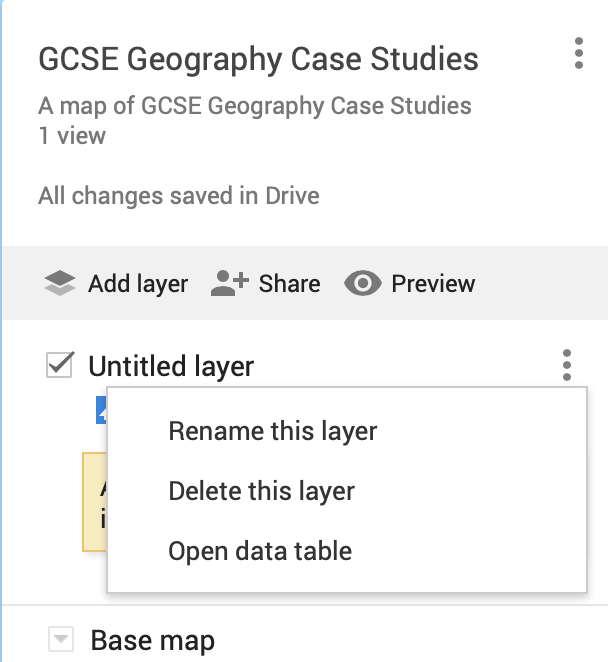
Rename the Untitled layer that has been automatically created. In this case, we will name it Natural Disasters. To do this click the icon showing 3 dots and select Rename This Layer.

Rename Layer

Rename Layer

Give your layer an appropriate name.

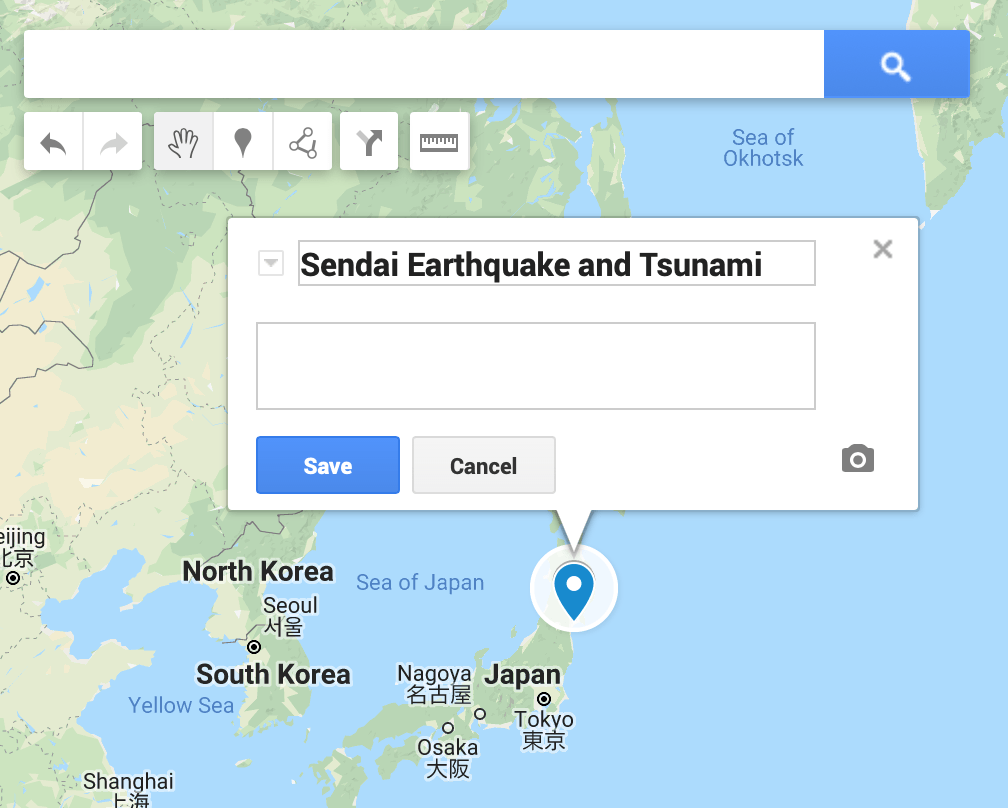
You are next going to add a marker to show the location of a natural disaster. In this case, we will add the Sendai earthquake and tsunami in Japan. To get started, locate the place where the natural hazard occurred. Then click the marker icon (it looks like an upside down droplet) then click the location where you want to place it. You can then rename the marker as shown below.

Adding a marker

Adding a marker

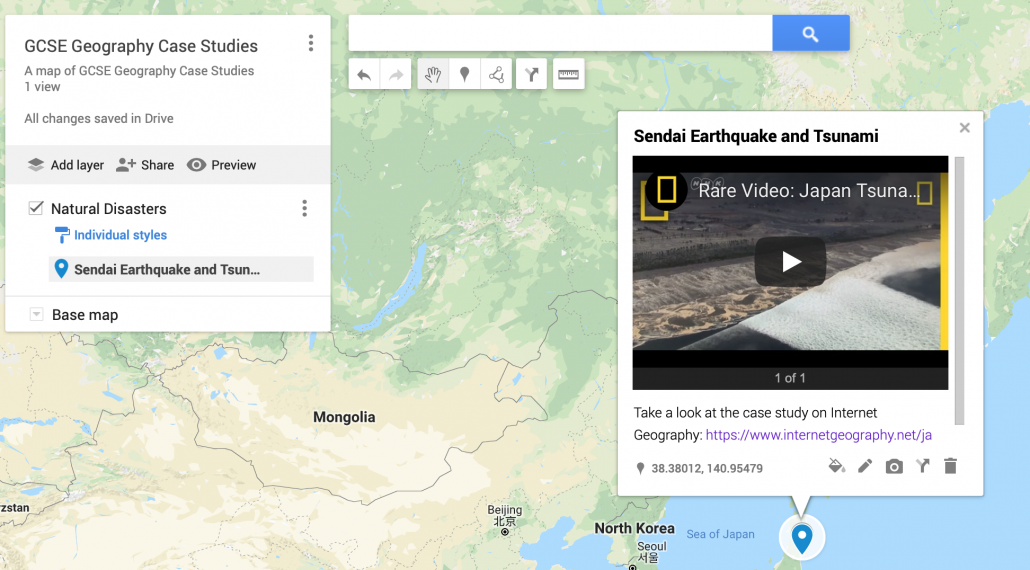
Next, you can add images and videos (such as those on YouTube) to the marker. You can also include hyperlinks to web pages that could be used for revision. Below is an example of a marker with a Youtube video embedded and a hyperlink to a case study on Internet Geography.

Marker with embedded YouTube video and hyperlink

Marker with embedded YouTube video and hyperlink

You now need to repeat this for all the case studies you want to include in this layer.

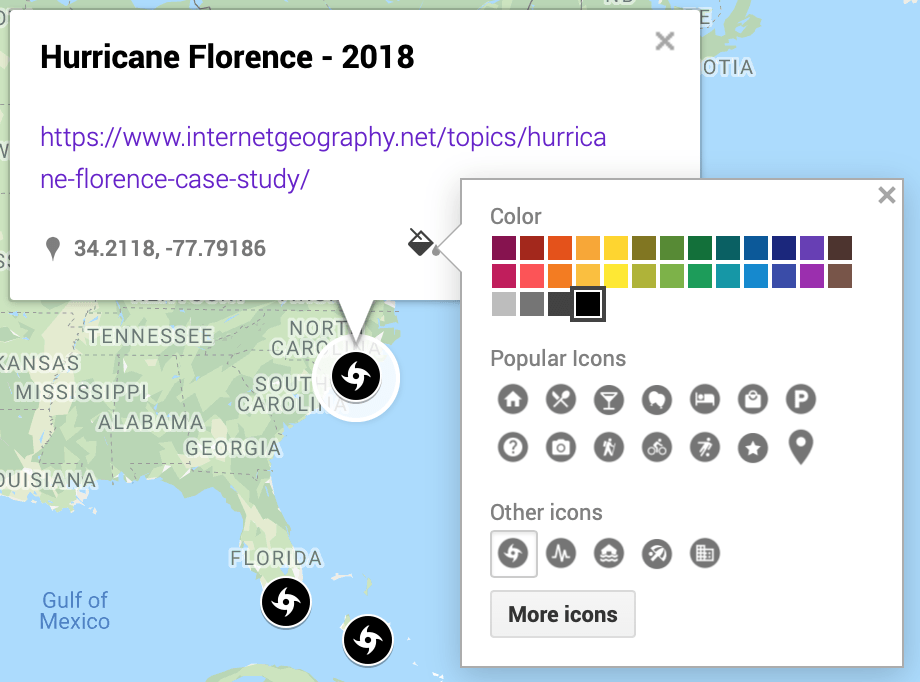
You can then create another layer and repeat the process. You can edit the colour and style of markers by theme. This will help differentiate the different markers. To do this click the bucket and select a colour of your choice, then click more icons to choose an appropriate icon.

Edit marker style

Edit marker style

You can filter your map by turning layers off to show the location of a particular category of case study. To do this de-select the tick next to the layer name.

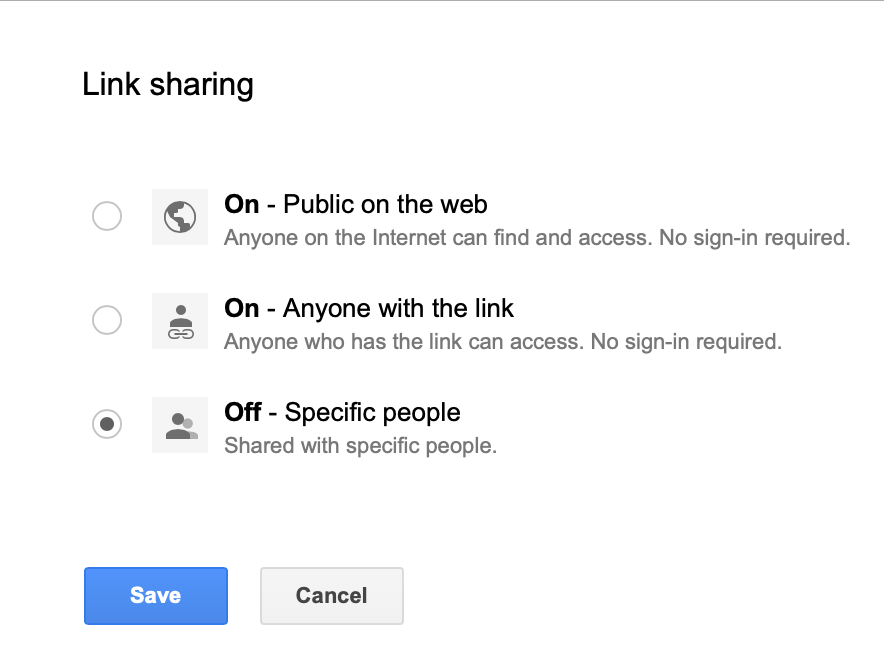
Once your map is finished you can share it by clicking the Share icon. Then click Change. Select an appropriate option. Once you’ve done this copy the link and share.

Link sharing options

Link sharing options

How can coastal fieldwork data be presented on Google My Maps?

How can river data be presented on Google My Maps?

How do I share Google My Maps?

Using the measurement tool in Google My Maps