Untreated Sewage and Our Rivers and Seas
In 2022, water firms in England discharged untreated sewage into rivers and seas for over 1.75 million hours.
According to data, there was an average of 825 daily sewage spills into water bodies, a 19% decrease from the year before.
However, the Environment Agency attributes this decline mainly to a drier climate rather than proactive measures taken by water companies.
While not against the law, scholars and environmental organizations argue that discharging sewage threatens public health.
During periods of heavy rainfall, water companies release sewage to alleviate the pressure on their treatment facilities.
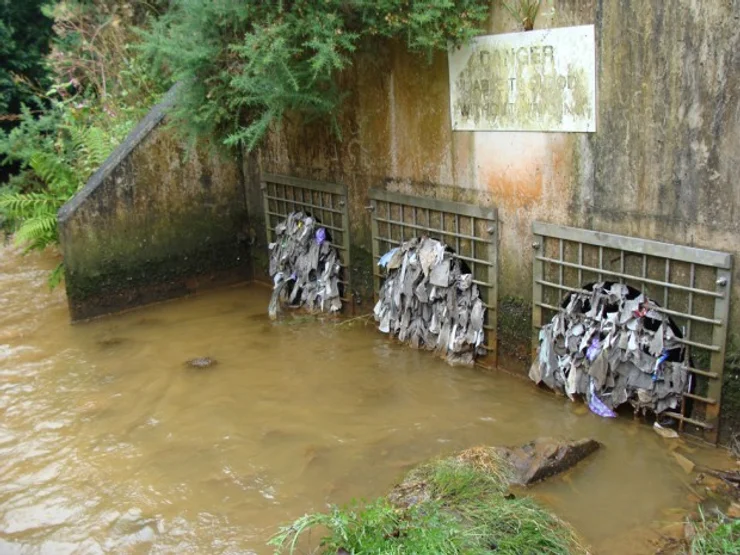
Untreated wastewater contains human excrement, wet wipes, and sanitary items, all of which present significant hazards to local wildlife, swimmers, and others who utilise UK waterways.
Professor Jamie Woodward, a geography expert at the University of Manchester, stated that these discharges “degrade valuable ecosystems and pose a danger to public health.”
He explained that each release is “a toxic mix of various pollutants, including microplastics and pathogens.”
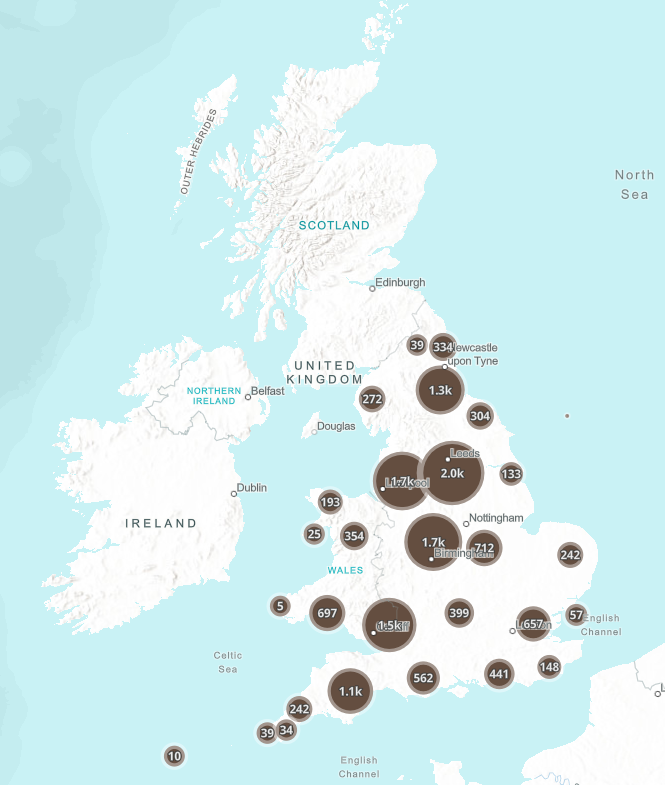
Was sewage discharged near you?
Click the map below to investigate sewage discharge near you.
New information recently released by the Environment Agency was obtained from monitoring stations located at combined sewer overflows, or CSOs. CSOs were designed as overflow valves to minimize the likelihood of sewage backups during periods of intense rainfall, which can cause sewer pipes to become overwhelmed and result in flooding.
These valves discharge a combination of untreated sewage originating from residential and commercial properties, as well as rainwater runoff.
A combined sewage overflow – source: https://www.essexsuffolkriverstrust.org/post/combined-sewer-overflows
Although the data indicates a 34% decrease in the duration of spills since 2021, John Leyland, the Environment Agency’s executive director, stated that the reduction in the previous year was “primarily due to dry weather, not water company action.”
He further emphasized the need for accelerated progress from water companies in minimizing spills and acting on monitoring data.
The data revealed that United Utilities, servicing the North West of England, had the highest number of sewage releases in 2022. The company discharged sewage for close to half a million hours.
The Environment Agency and water regulator Ofwat is investigating six water companies for potential breach of the law over their discharges.
The government has pledged to tackle sewage spills by making water companies invest £56 billion over 25 years to enhance their infrastructure. Additionally, they must equip all storm overflows in the network with event duration monitoring (EDM) devices by the end of the current year.
Many people feel this is not enough to tackle sewage discharge in rivers and seas.
The graph below shows the status classification of surface water bodies (rivers, canals, lakes, estuaries and coastal water bodies) in England. The graph shows the percentage of water bodies with high, good, moderate, poor or bad ecological potential. A good status means a body of water has a slight variation from undisturbed conditions, meaning it is almost as it should be naturally.
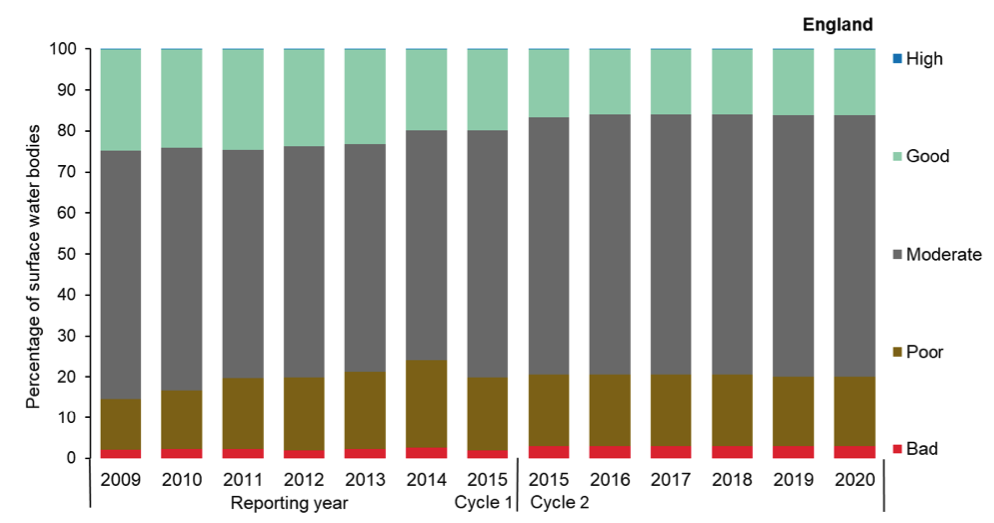
Status classification of surface water bodies in England – source: https://assets.publishing.service.gov.uk/government/uploads/system/uploads/attachment_data/file/1025323/21_Surface_water_status.pdf
There has been a decrease in the proportion of surface water bodies in England awarded high or good ecological status since the indicator was first prepared in 2009; the indicator has also declined in the short term, between 2015 and 202. In 2021, 16% of surface water bodies assessed under the Water Framework Directive (WFD) were in high or good status compared with 17% in 2015 and 25% in 2009.


Leave a Reply
Want to join the discussion?Feel free to contribute!